. 2021 Apr 28;10:e64944. doi: 10.7554/eLife.64944

Figure 1. Suppressed tuft formation in the Nos3S1176A/S1176A retina after OIR-challenge.

(A) Outline of OIR-challenge protocol; pups were placed in 75% O2 (hyperoxia) between P7 and P12, followed by return to normal atmosphere (relative hypoxia) until P17. (B) Schematic representation of vascular abnormalities after OIR in P17 retinas. (C) Nitric oxide formation determined using a Griess assay, expressed as the combined concentration of nitrite and nitrate, the end products of NO, reacting with molecules in biological fluids. Mean ± S.E.M. n = 3 mice/genotype. ****p<0.0001; t-test. (D) Representative images of whole mount retinas from Nos3+/+ and Nos3S1176A/S1176A mice, collected at P17 after OIR-challenge, stained with isolectin B4 (IB4). Avascular area is marked in magenta and tufts in blue. Scale bar = 500 µm. (E, F) Tuft area (E) and avascular area (F) expressed as percentage of total vascular area at P17. (G, H) Tuft size in µm2 (G) and total number/FOV in P17 mice (H). For (EH): mean ± S.E.M. n = 7 (Nos3+/+) and 5 (Nos3S1176A/S1176A) mice. *p<0.05; t-test.

Figure 1—source data 1. Excel file containing numerical values collected from NO formation assays and OIR-induced tuft formation experiments in Nos3+/+ and Nos3S1176A/S1176A mice shown in Figure 1, Figure 1—figure supplements 14.

Figure 1.

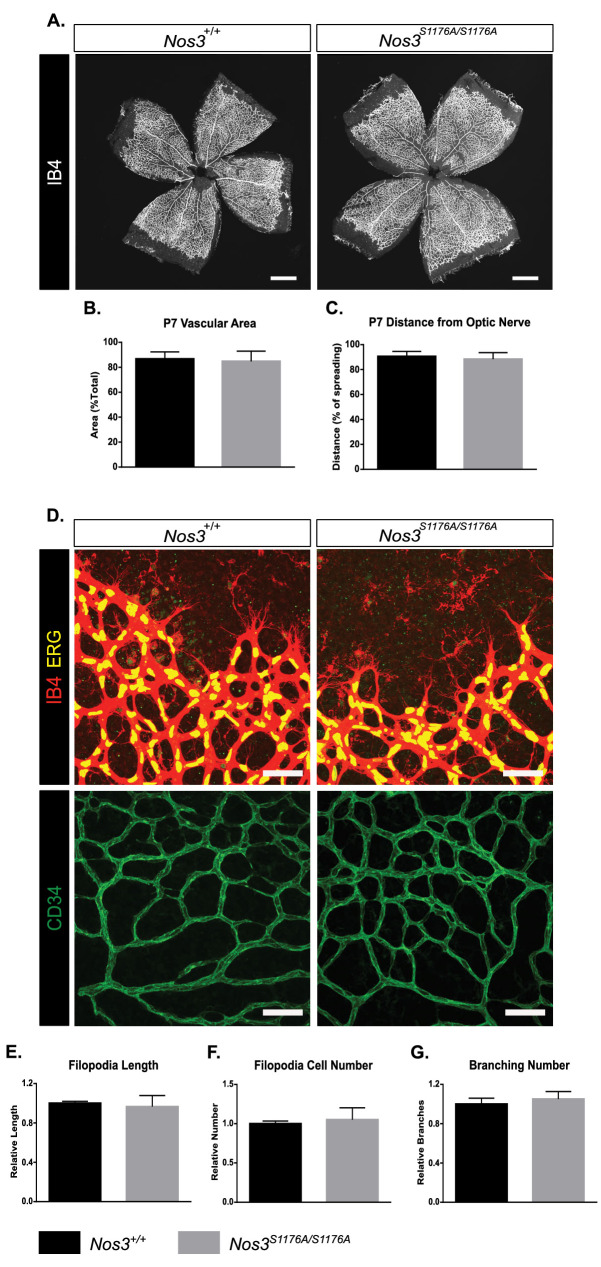
Figure 1—figure supplement 1. Postnatal development of Nos3+/+ and Nos3S1176A/S1176A retinal vasculature.

Figure 1—figure supplement 1.

(A) Representative images of Nos3+/+ and Nos3S1176A/S1176A retinas collected at P7, stained with isolectin B4 (IB4). (B, C) Quantification of vascular area (B) and outgrowth from the optic nerve (C) at P7 in Nos3+/+ and Nos3S1176A/S1176A pups. (D) Representative images of the vessel front from whole mount retinas collected at P7 stained with Isolectin-B4 (IB4, red, upper), ERG (yellow, upper), and CD34 (green, lower), to visualize vessel outgrowth and tip cells in Nos3+/+ and Nos3S1176A/S1176A retinal vasculature. Scale bar = 50 µm. (E–G) Filopodia length (E), tip cell number (F), branch points (G) in Nos3+/+ and Nos3S1176A/S1176A retinas at P7. Mean ± S.E.M. n = 3 (Nos3+/+) and 4 (Nos3S1176A/S1176A) mice, five to six images per mouse; t-test.
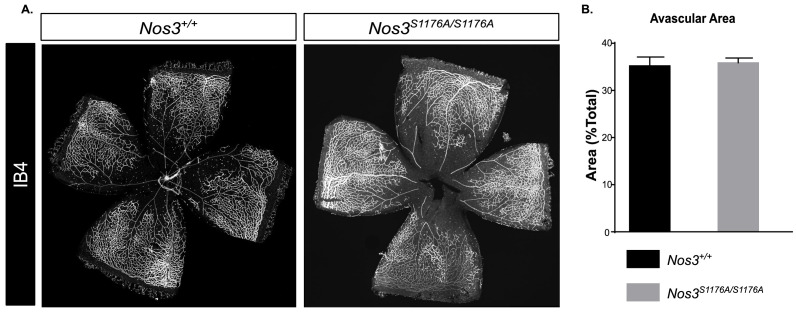
Figure 1—figure supplement 2. Retina characteristics in Nos3+/+ and Nos3S1176A/S1176A P12 pups.

Figure 1—figure supplement 2.

(A) Representative images of whole mount Nos3+/+ and Nos3S1176A/S1176A retinas collected at P12 after the vessel destruction phase of OIR and before vessel regrowth, stained with isolectin B4 (IB4). Scale bar = 500 µm. (B) Avascular area in Nos3+/+ and Nos3S1176A/S1176A retinas at P12 after OIR. n = 4 (Nos3+/+) and 5 (Nos3S1176A/S1176A) mice, three independent experiments; t-test.
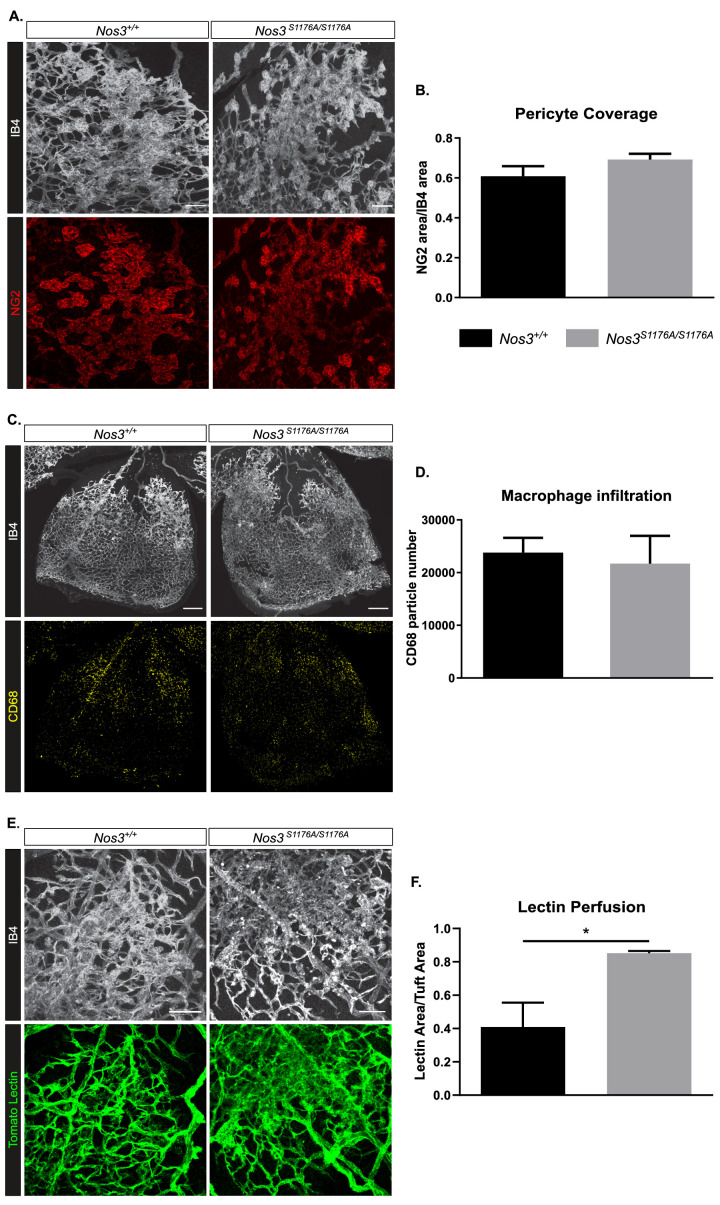
Figure 1—figure supplement 3. Pericytes, macrophage influx, and vascular perfusion in OIR-challenged Nos3+/+ and Nos3S1176A/S1176A retinas.

Figure 1—figure supplement 3.

(A) Representative images of tufts visualized by IB4 binding and co-stained for NG2 (red) to mark pericytes in Nos3+/+ and Nos3S1176A/S1176A retinas collected at P17. Scale bar = 100 μm. (B) Pericyte coverage expressed as the NG2-positive area normalized to the IB4 area. Mean ± S.E.M. n = 4 (Nos3+/+) and 4 (Nos3S1176A/S1176A) mice. t-test. (C) Representative images of one leaf of the retina (IB4) co-stained for CD68 (yellow) to mark circulatory/tissue macrophages in Nos3+/+ and Nos3S1176A/S1176A retinas collected at P17. Scale bar = 200 μm. (D) The number of CD68-positive macrophages in the entire retina represented by particle number, normalized to the retina area. Mean ± S.E.M. n = 4 (Nos3+/+) and 4 (Nos3S1176A/S1176A) mice. t-test. (E) Representative images of tufts with circulating tomato lectin (green), co-stained with IB4 in Nos3+/+ and Nos3S1176A/S1176A retinas collected at P17. Scale bar = 100 μm. (F) Tuft perfusion, expressed as the area of tomato lectin normalized to the IB4 area. Mean ± S.E.M. n = 4 (Nos3+/+) and 4 (Nos3S1176A/S1176A) mice. *p<0.05; t-test.
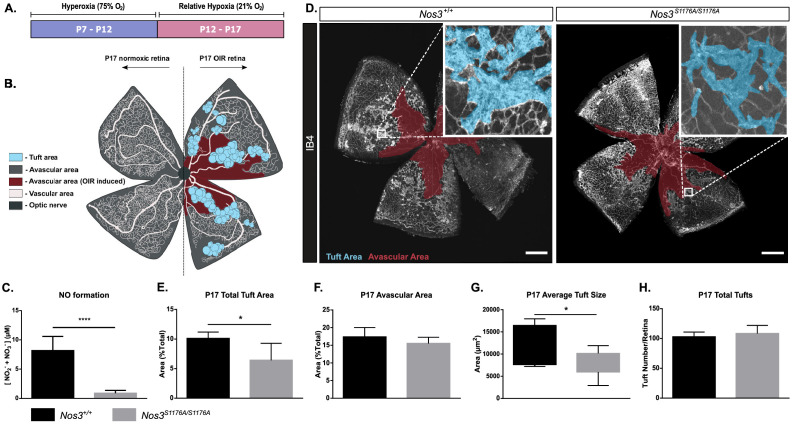
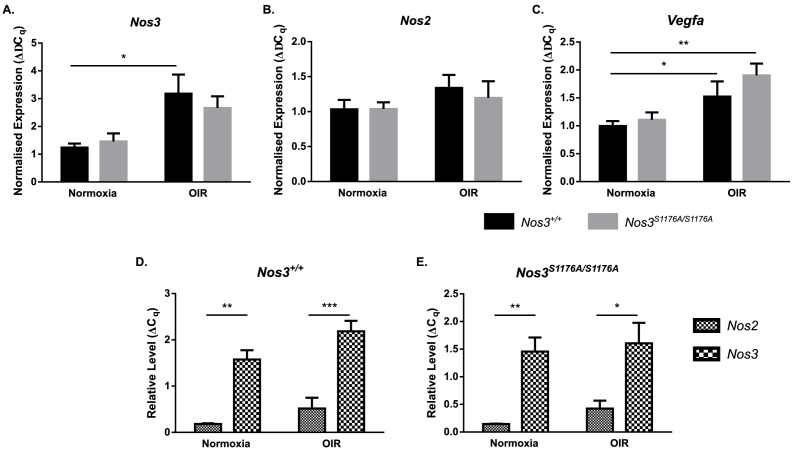
Figure 1—figure supplement 4. Expression of Nos2, Nos3, and Vegfa in Nos3+/+ and Nos3S1176A/S1176A retinas.

Figure 1—figure supplement 4.

(A–C) qPCR of Nos3 (A), Nos2 (B), and Vegfa (C) expression in P17 normoxic and OIR-challenged Nos3+/+ and Nos3S1176A/S1176A mouse retinas. (D, E) Relative levels of Nos2 and Nos3 compared against standard curves of TBP and UBC in Nos3+/+ (D) and Nos3S1176A/S1176A (E) retinas. Mean ± S.E.M. n = 5 (Nos3+/+) and 5 (Nos3S1176A/S1176A) mice. Three independent experiments. *, **, ***p<0.05, 0.01, 0.001; two-way ANOVA, Sidak’s multiple comparison test.