. 2021 Apr 28;10:e64944. doi: 10.7554/eLife.64944

Figure 4. OIR-challenged mice treated with NO inhibitor L-NMMA.

(A) Representative images of whole mount retinas from PBS- and L-NMMA-treated (P12–P16) wild-type C57Bl/6 mice, collected on P17 after OIR-challenge, and stained with isolectin B4 (IB4). Avascular area as a result of OIR is marked in magenta and tufts in blue. Scale bar = 500 µm. (B, C) Tuft area and avascular area expressed as percentage of total vascular area at P17. (D, E) Tuft size in µm2 and total number of tufts/field of vision at P17. Mean ± S.E.M. n = 8 (PBS) and 9 (L-NMMA) treated mice. *, **p<0.05, 0.01; t-test. (F) Representative images of whole mount IB4-stained P17 retinas from OIR-challenged VEC-WT and VEC-Y685F mice injected with PBS or L-NMMA during P12-P16. Avascular area is marked in magenta and tufts in blue. Scale bar = 500 µm. (G) Tuft area normalized to total vascular area in PBS or L-NMMA-treated VEC-WT and VEC-Y685F retinas. (H) Avascular area normalized to total vascular area. Mean ± S.E.M. n = 8 (VEC-WT) and 8 (VEC-Y685F) mice. **, ***p<0.01, 0.001; two-way ANOVA, Sidak’s multiple comparison test.

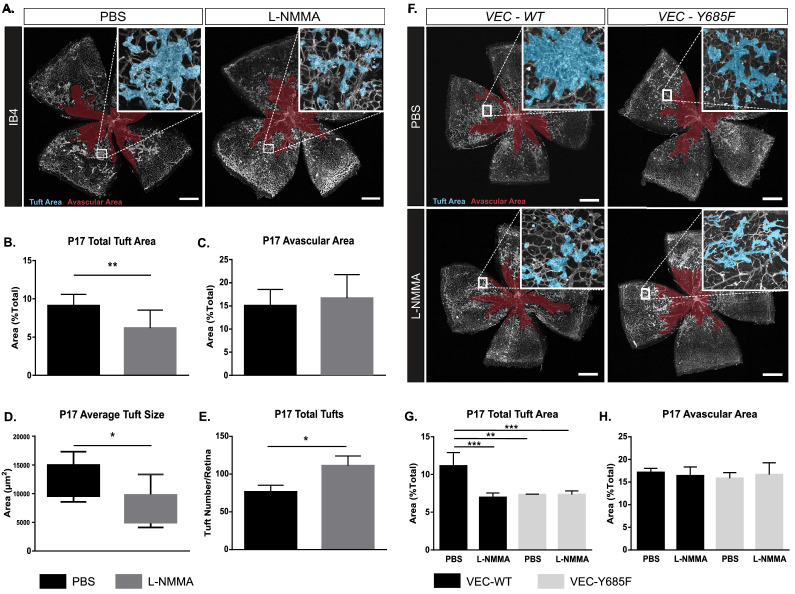
Figure 4—source data 1. Excel file containing numerical values collected from OIR-induced tuft formation experiments in PBS- and L-NMMA-treated WT retinas shown in Figure 4 and Figure 4—figure supplement 1.

Figure 4.

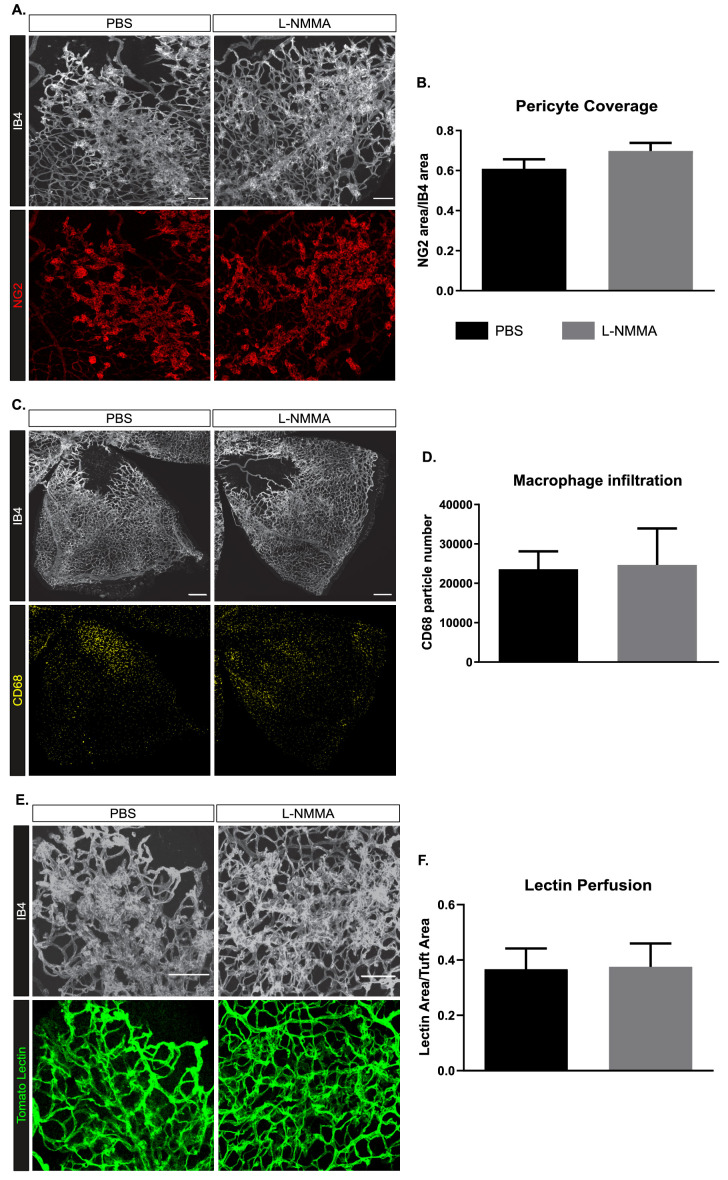
Figure 4—figure supplement 1. Pericytes, macrophage influx, and vascular perfusion in OIR-challenged WT retinas treated with PBS or L-NMMA.

Figure 4—figure supplement 1.

(A) Representative images of tufts visualized by IB4 binding and co-stained for NG2 (red) to mark pericytes in PBS and L-NMMA-treated retinas collected at P17. Scale bar = 100 μm. (B) Pericyte coverage expressed as the NG2-positive area normalized to the IB4 area. Mean ± S.E.M. n = 4 (PBS) and 4 (L-NMMA) mice. t-test. (C) Representative images of one leaf of the retina (IB4) co-stained for CD68 (yellow) to mark circulatory/tissue macrophages in PBS and L-NMMA treated retinas collected at P17. Scale bar = 200 μm. (D) The number of CD68-positive macrophages in the entire retina represented by particle number, normalized to the retina area. Mean ± S.E.M. n = 4 (Nos3+/+) and 4 (Nos3S1176A/S1176A) mice. t-test. (E) Representative images tufts with circulating tomato lectin (green) co-stained with IB4 in PBS- and L-NMMA-treated retinas collected at P17. Scale bar = 100 μm. (F) Tuft perfusion, expressed as the tomato lectin area normalized to the IB4 area Mean ± S.E.M. n = 4 (PBS) and 4 (L-NMMA) mice. t-test.