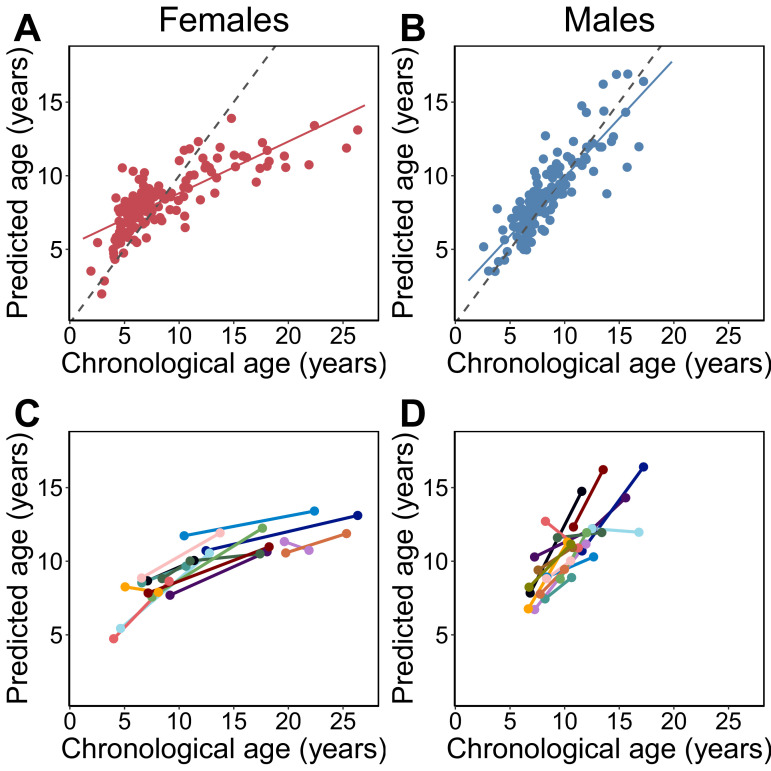
Figure 1. Epigenetic clock age predictions in the Amboseli baboons.
Predicted ages are shown relative to true chronological ages for (A) females (Pearson’s r = 0.78, p=6.78×10⁻³⁰, N = 142 samples) and (B) males (r = 0.86, p=5.49×10−41, N = 135 samples). Solid lines represent the best-fit line; dashed lines show the line for y = x. (C, D) Predictions for individuals with at least two samples in the data set (N = 30; 14 females and 16 males). In 26 of 30 cases (87%), samples collected later were correctly predicted to be from an older animal.

