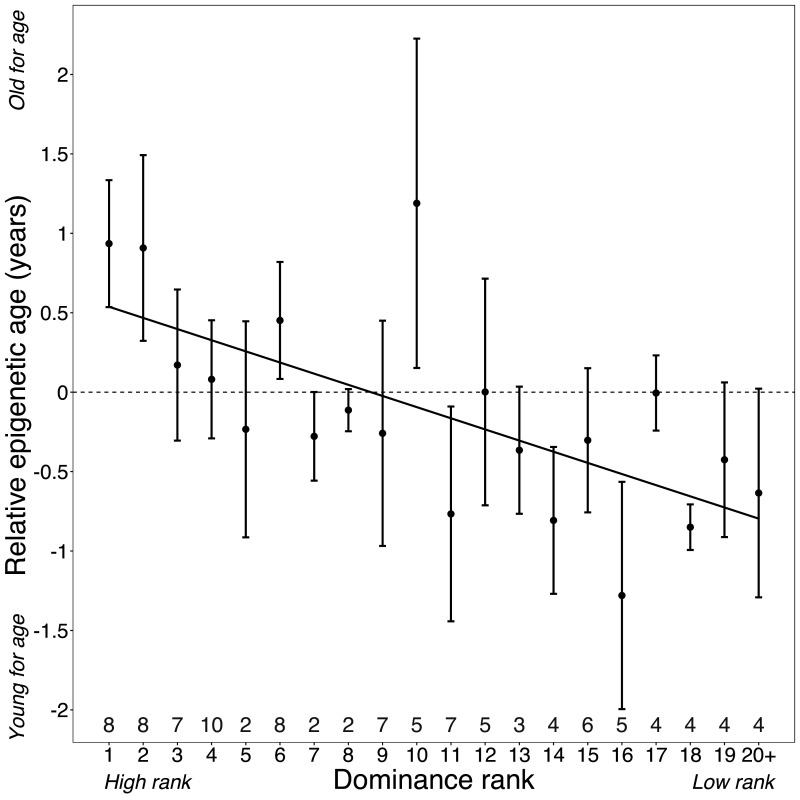
Figure 2. Dominance rank predicts relative epigenetic age in male baboons.
High rank is associated with elevated values of Δage (β = −0.0785, p=7.39×10⁻⁴, N = 105). The y-axis shows relative epigenetic age, a measure of epigenetic aging similar to Δage that is based on the sample-specific residuals from the relationship between predicted age and true chronological age. Positive (negative) values correspond to predicted ages that are older (younger) than expected for that chronological age. Dominance rank is measured using ordinal values, such that smaller values indicate higher rank. Dots and error bars represent the means and standard errors, respectively. Gray values above the x-axis indicate sample sizes for each rank.
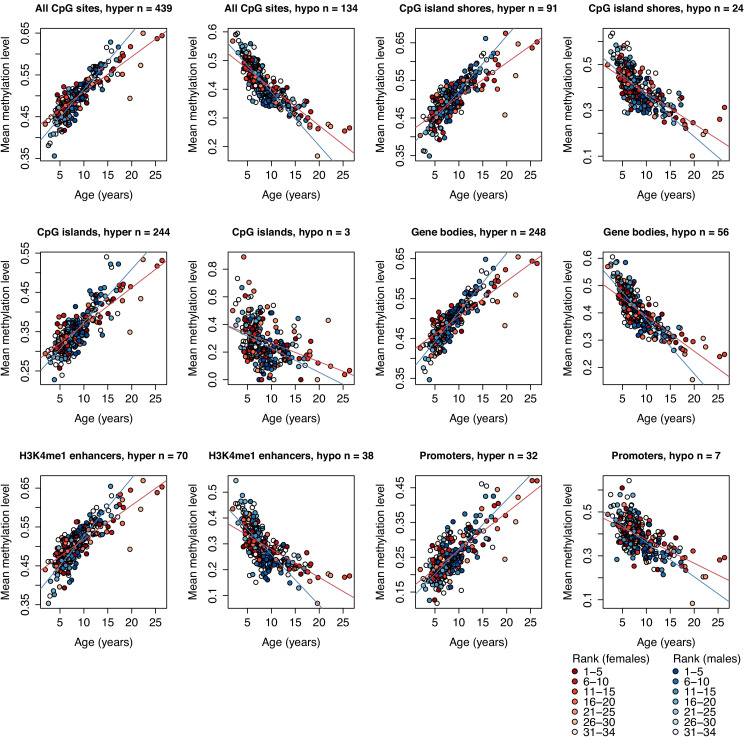
Figure 2—figure supplement 1. Methylation levels of clock CpG sites across different genomic compartments.
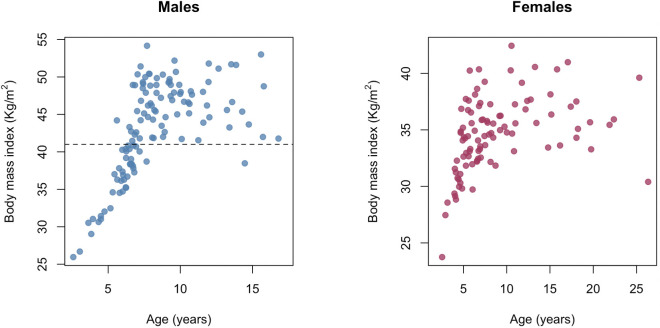
Figure 2—figure supplement 2. The relationship between age and body mass index in the Amboseli baboons.
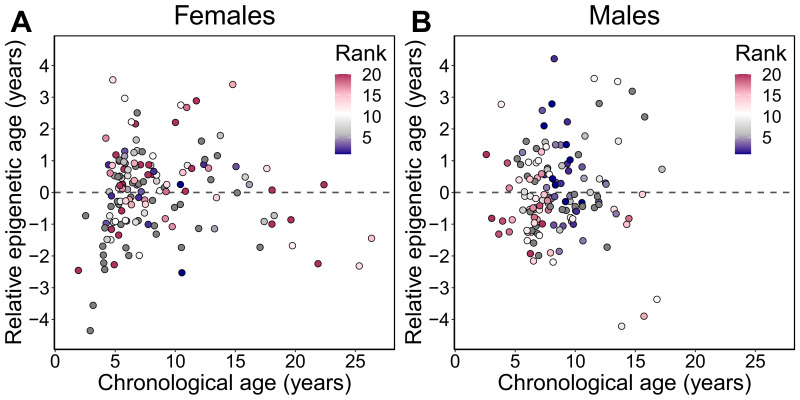
Figure 2—figure supplement 3. Relative epigenetic age versus chronological age.
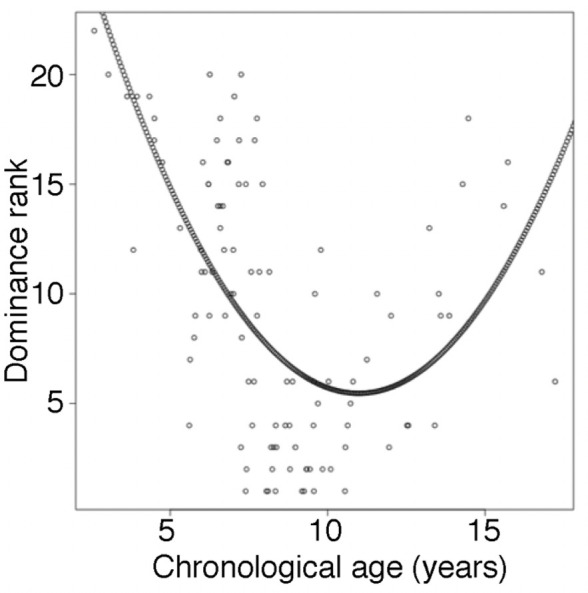
Figure 2—figure supplement 4. Male dominance rank versus chronological age.
