Figure 1. Statistical mechanical modeling of SOD1 folding mechanism.
(a) Cartoon representation of SOD1 monomer highlighting the various structural elements. The positions of the mutation for H121F and H72F have been arrow marked. (b) Residue folding probability as a function of residue index for the different variants of SOD1 as predicted by the bWSME model. Note that WT represents the variant in which both the metallic cofactors are bound. (c) Average folding probabilities colored in the spectral scale going from 0 (dark blue) to 1 (dark red) as a function of the reaction coordinate, number of structured blocks. The vertical white dashed line signals the parts of the protein that fold first. For example, it can be seen that residues 1–40 fol d early in the apo SOD1 (dark red) when compared to WT where residues 40–80 fold first.

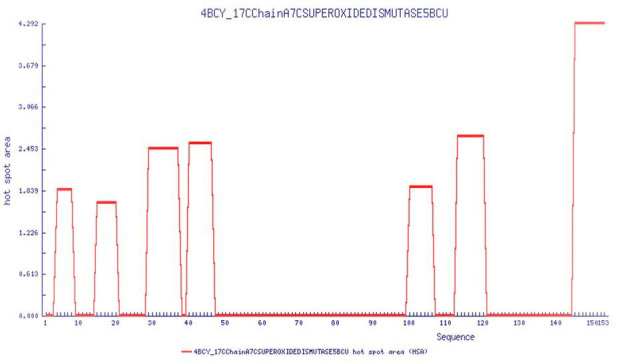
Figure 1—figure supplement 1. Aggregation prone regions as a function of sequence from AGGRESCAN software (http://bioinf.uab.es/aggrescan/ ).