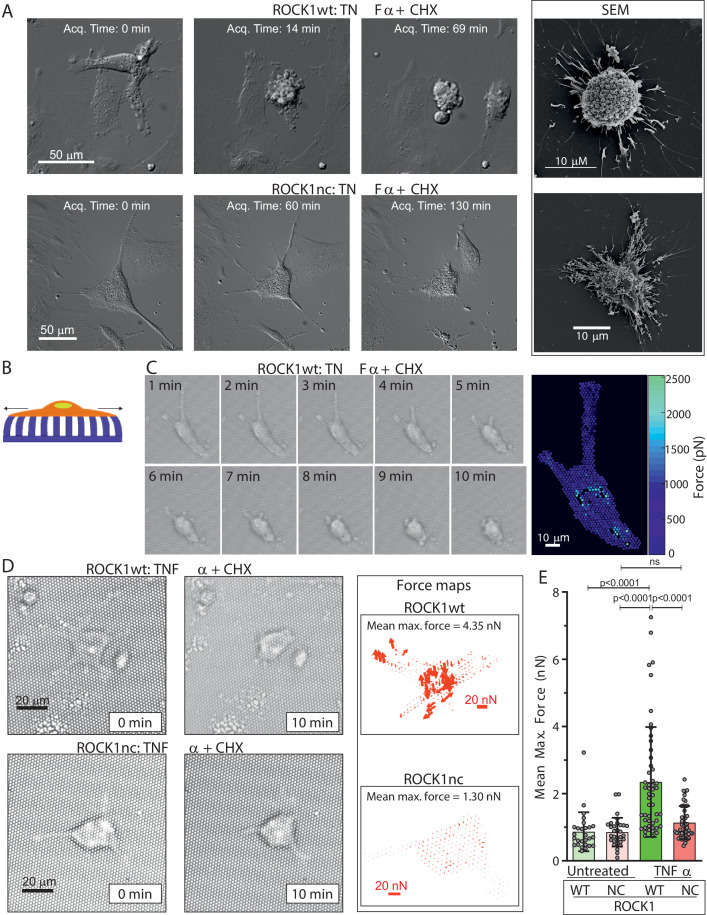
Figure 2. Apoptotic ROCK1nc mouse embryo fibroblasts (MEFs) do not undergo forceful contraction.
(A) Homozygous ROCK1wt (upper panels) or ROCK1nc (lower panels) MEFs were serum-starved overnight, then treated with tumour necrosis factor α (TNFα) (50 ng/mL) plus cycloheximide (CHX) (10 µg/mL) to induce apoptosis. Differential interference contrast time-lapse microscopy images were acquired at 3 min intervals after the addition of TNFα plus CHX. Scale bar = 50 µm. Right panels: scanning electron microscope images. Scale bar = 10 µm. (B) Schematic diagram of a cell on elastic micropillars. (C) Homozygous ROCK1wt MEFs plated on elastic micropillars were serum-starved overnight, then treated with TNFα plus CHX to induce apoptosis. Brightfield time-lapse microscopy images were acquired at 2 s intervals after the commencement of cell contraction over 10 min. Right panel: force heat map indicating the magnitude of the force applied to each individual pillar. Scale bar = 10 µm. (D) Homozygous ROCK1wt (upper panels) or ROCK1nc (lower panels) MEFs were serum-starved overnight, then treated with TNFα plus CHX to induce apoptosis. Brightfield time-lapse microscopy images were acquired at 2 s intervals after the commencement of cell contraction over 10 min. Right panels: force vector map with direction and magnitude of the forces applied to each individual pillar. Scale bar = 20 nN. Mean maximum force is the average of the maximum forces applied to each pillar over 10 min. (E) Mean maximum force for untreated or TNFα plus CHX-treated homozygous ROCK1wt (green) or ROCK1nc (red) MEFs. Means ± SD n=27–50 individual cells. One-way ANOVA with post-hoc Tukey’s multiple comparison test; ns: not significant.


