. 2021 Apr 19;10:e61983. doi: 10.7554/eLife.61983

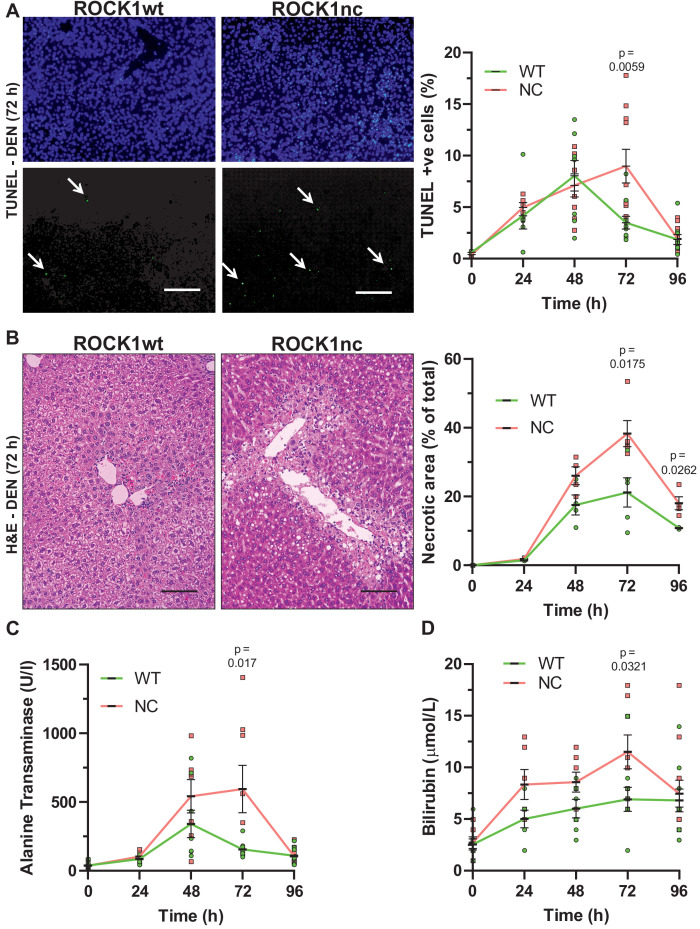
Figure 3. Elevated chemically induced liver damage in ROCK1nc mice.

(A) Terminal deoxynucleotidyl transferase dUTP nick end labelling (TUNEL) staining of apoptotic cells in representative liver sections from ROCK1wt or ROCK1nc mice 72 hr after diethylnitrosamine (DEN) injection. TUNEL-positive cells (lower panel, green) were scored as a percentage of the total 4′,6-diamidino-2-phenylindole (DAPI; upper panel, blue) cell numbers from 10 random fields per section per mouse. Scale bar = 100 µm. Right panel: means ± SEM, n = 3–11 mice at each time. Pairwise Student’s t-test at each time. (B) Haematoxylin and eosin (H&E) staining of representative liver sections from ROCK1wt or ROCK1nc mice 72 hr after DEN injection. Scale bar = 100 µm. Liver necrotic areas were scored as a percentage of the total area from 10 random fields per section per mouse. Right panel: means ± SEM, n = 3–5 mice at each time. Pairwise Student’s t-test at each time. (C) Sera from 10-week-old homozygous ROCK1wt (WT) and ROCK1nc (NC) mice treated with DEN (100 mg/kg body weight) were assessed for alanine transaminase and (D) bilirubin levels at indicated times after intraperitoneal injection. Means ± SEM, n = 6–11 mice at each time. Pairwise Student’s t-test at each time.

Figure 3.

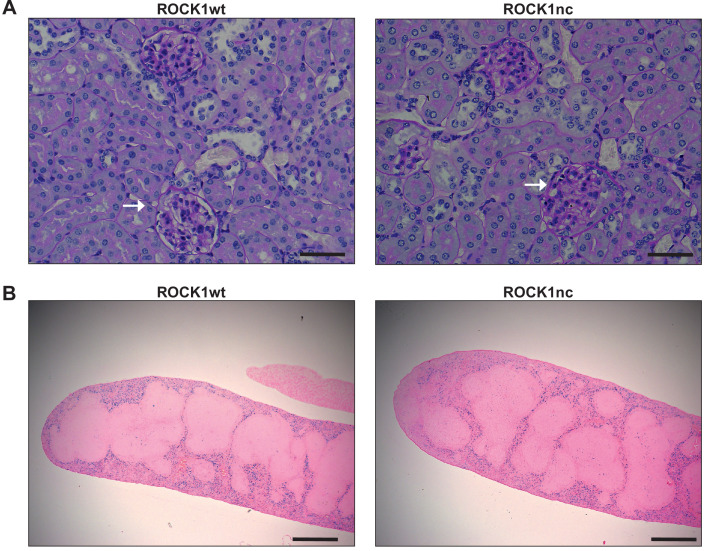
Figure 3—figure supplement 1. Absence of indications of autoimmunity in aged ROCK1wt or ROCK1nc kidneys or spleens.

Figure 3—figure supplement 1.

(A) Representative periodic acid-Schiff (PAS)-stained kidney sections from ROCK1wt and ROCK1nc mice showing no observable differences in basement membrane thickening (white arrows). Scale bars represent 100 µm. (B) Representative Perls Prussian blue-stained spleen sections showing no observable differences in hemosiderin deposition between the two genotypes. Scale bars represent 500 µm.
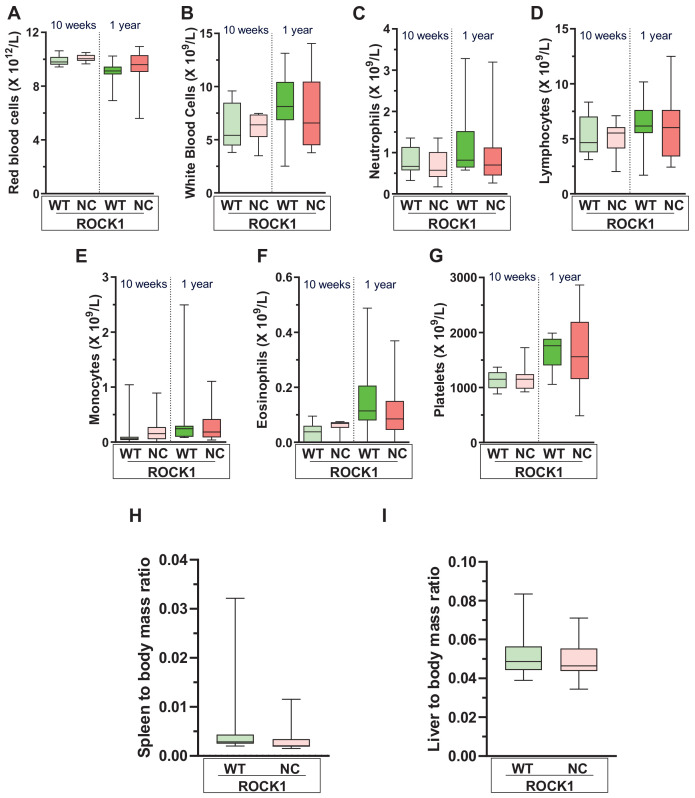
Figure 3—figure supplement 2. Ageing does not affect blood cells, liver or spleen masses differently in ROCK1wt or ROCK1nc mice.

Figure 3—figure supplement 2.

Numbers of (A) red blood cells, (B) white blood cells, (C) neutrophils, (D) lymphocytes, (E) monocytes, (F) eosinophils, or (G) platelets in ROCK1wt or ROCK1nc mice 10 weeks (ROCK1wt n = 11 mice; ROCK1nc n = 10 mice) or 1 year (ROCK1wt n = 9 mice; ROCK1nc n = 15 mice) after birth. Boxes indicate upper and lower quartiles and median, whiskers indicate 5–95% percentiles. (H) Spleen to body mass ratios and (I) liver to body mass ratios for ROCK1wt (n = 15 mice) and ROCK1nc (n = 18 mice) 1 year after birth. Boxes indicate upper and lower quartiles and median, whiskers indicate 5–95% percentiles.