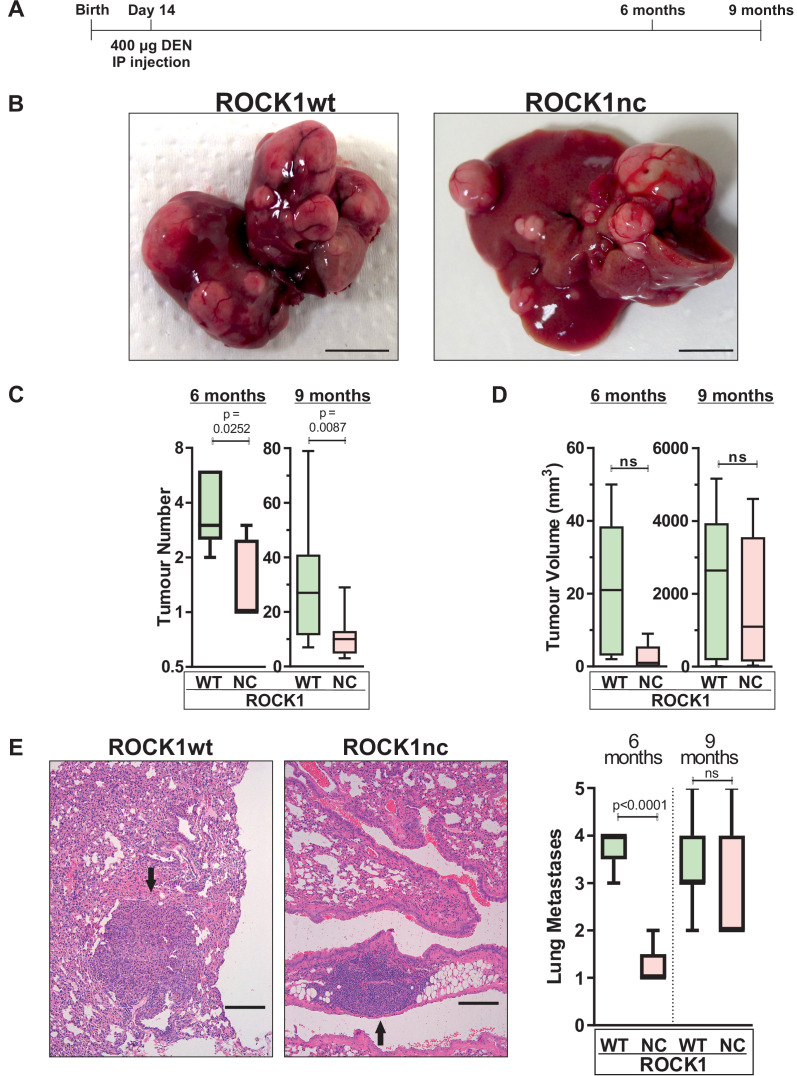
Figure 6. Diethylnitrosamine (DEN)-induced hepatocellular carcinoma (HCC) tumour numbers are lower in ROCK1nc mice.
(A) Timeline of DEN-induced HCC protocol. (B) Macroscopic view of representative livers from ROCK1wt and ROCK1nc mice 9 months after HCC initiation with DEN. Scale bars = 1 cm. (C) Tumour numbers were counted in ROCK1wt and ROCK1nc livers 6 months (n = 5 mice for each genotype) or 9 months (12 mice for each genotype) after HCC initiation with DEN. Boxes indicate upper and lower quartiles and median, whiskers indicate 5–95% percentiles, pairwise Student’s t-test as indicated. (D) Total tumour volume per ROCK1wt or ROCK1nc liver 6 months (n = 5 mice for each genotype) or 9 months (12 mice for each genotype) after HCC initiation with DEN. Boxes indicate upper and lower quartiles and median, whiskers indicate 5–95% percentiles, pairwise Student’s t-test as indicated; ns: not significant. (E) Representative H&E-stained lung sections from ROCK1wt and ROCK1nc mice 9 months after HCC initiation with DEN. Black arrow indicates metastatic nodules. Scale bars = 100 µm. Numbers of lung metastases were counted in ROCK1wt and ROCK1nc mice 6 months (n = 5 mice for each genotype) or 9 months (12 mice for ROCK1wt, 7 mice for ROCK1nc) after HCC initiation with DEN. Right panel: boxes indicate upper and lower quartiles and median, whiskers indicate 5–95% percentiles, pairwise Student’s t-test as indicated; ns: not significant.

