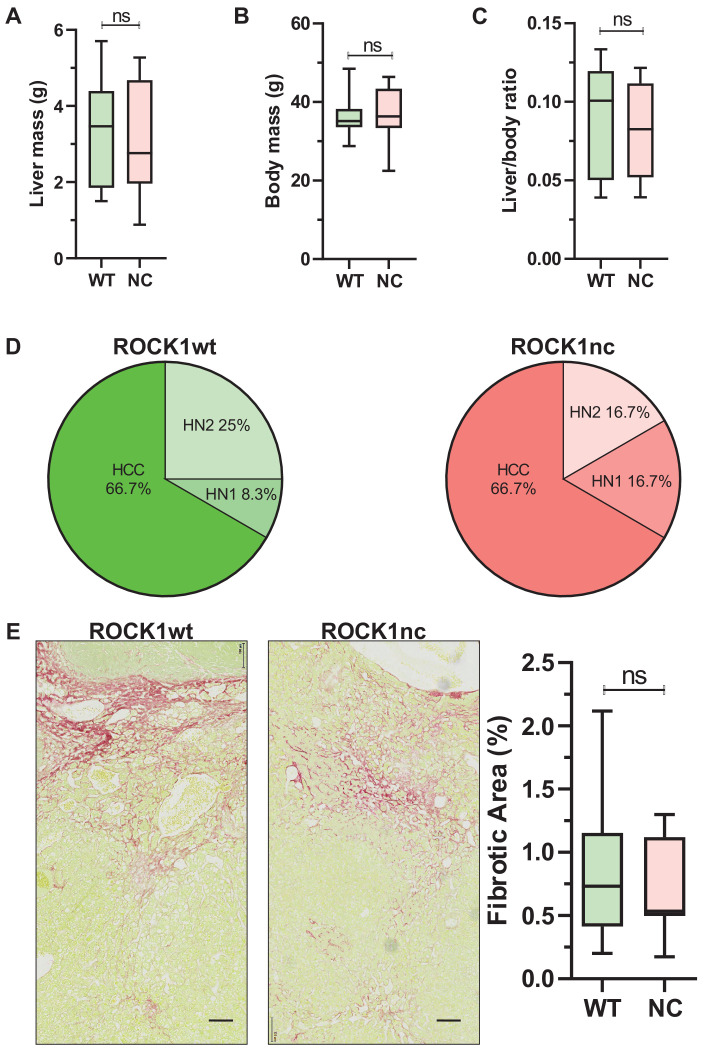
Figure 7. Similar liver mass and tumour grades in diethylnitrosamine (DEN)-treated ROCK1wt and ROCK1nc mice.
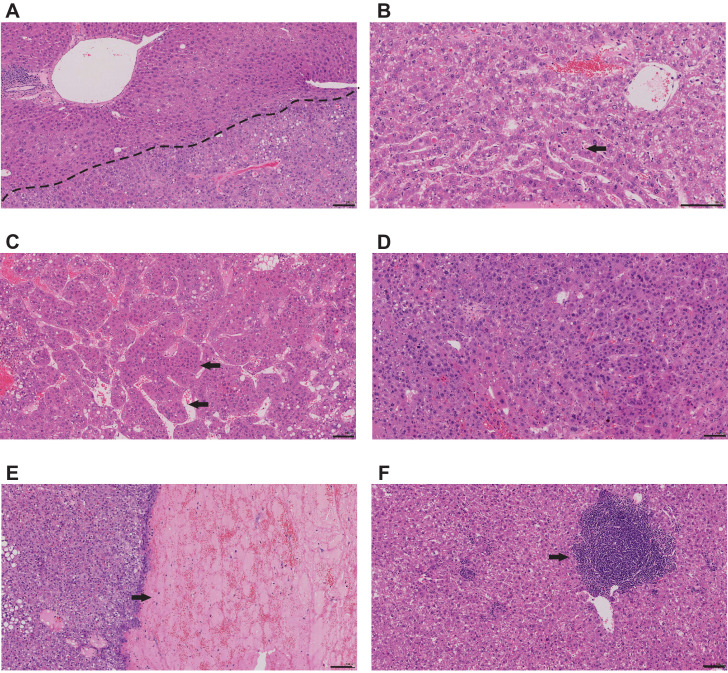
(A) Liver mass, (B) body mass and (C) liver to body ratios for ROCK1wt and ROCK1nc mice (n = 12 mice for each genotype) 9 months after hepatocellular carcinoma (HCC) initiation with DEN. Boxes indicate upper and lower quartiles and median, whiskers indicate 5–95% percentiles, pairwise Student’s t-test as indicated; ns: not significant. (D) Tumour classification in ROCK1wt (left) and ROCK1nc (right) mice (n = 12 mice for each genotype) 9 months after HCC initiation with DEN. H&E-stained sections liver tumours were classified into three types: hepatic nodule 1 (HN1), hepatic nodule 2 (HN2) and HCC in increasing order of tumour grade as described by Yanagi et al., 1984. HN1 mainly comprised tumour nodules with slight difference from the normal hepatic architecture but produced obvious compression of the surrounding parenchyma. HN2 consisted of two- to three-cell thick irregular trabecular arrangements with well-maintained sinusoidal spaces. HCC exhibited irregular macrotrabecular arrangement with dilated sinusoidal spaces. (E) Photomicrographs of liver sections from ROCK1wt and ROCK1nc mice 9 months after DEN injection stained with Sirius Red and counterstained with Fast Green. Scale bars represent 100 µm. Percentage fibrotic area measured as Sirius Red positive area relative to the total area analysed, showing no significant difference between the two genotypes (ROCK1wt n = 8 mice; ROCK1nc n = 7 mice). Right panel: boxes indicate upper and lower quartiles and median, whiskers indicate 5–95% percentiles, pairwise Student’s t-test as indicated; ns: not significant.


