
Figure 3.
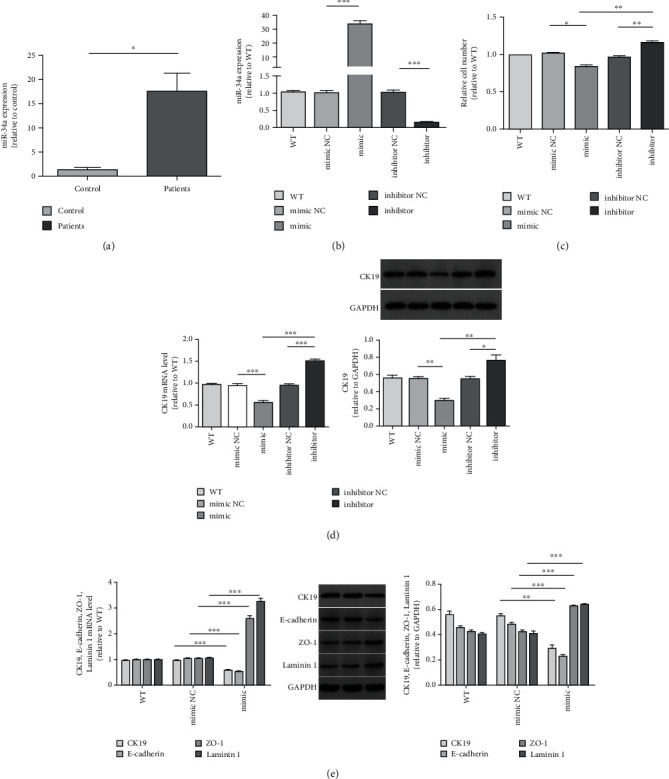
miR-34 expression in the serum of PBC patients and healthy controls and HIBEC proliferation in vitro. (a) miR-34a was significantly overexpressed in the sera of PBC patients (P = 0.048∗). (b) Expression of miR-34a of HIBEC transfected by miR-34a mimics, inhibitor, and controls (miR-34a mimics vs. NC, P < 0.0001∗∗∗ and miR-34a inhibitor vs. NC, P < 0.0001∗∗∗). (c) Relative cell number measured by using CCK8 (miR-34a mimics vs. NC, P = 0.0155∗; miR-34a mimics vs. inhibitor, P = 0.0039∗∗; and miR-34a inhibitor vs. NC, P = 0.0037∗∗). (d) CK19 mRNA level of each group (miR-34a mimics vs. NC, P < 0.0001∗∗∗; miR-34a mimics vs. inhibitor, P < 0.0001∗∗∗; and miR-34a inhibitor vs. NC, P < 0.0001∗∗∗). Relative CK19 protein expression (miR-34a mimics vs. NC, P = 0.0013∗∗; miR-34a mimics vs. inhibitor, P = 0.0026∗∗; and miR-34a inhibitor vs. NC, P = 0.0404∗). (e) CK19, E-cadherin, ZO-1, and laminin 1 mRNA levels between miR-34a mimics and NC (P < 0.0001∗∗∗, P < 0.0001∗∗∗, P < 0.0001∗∗∗, and P < 0.0001∗∗∗). CK19, E-cadherin, ZO-1, and laminin 1 protein expressions between miR-34a mimics and NC (P = 0.0013∗∗, P = 0.0003∗∗∗, P = 0.0007∗∗∗, and P = 0.0003∗∗).