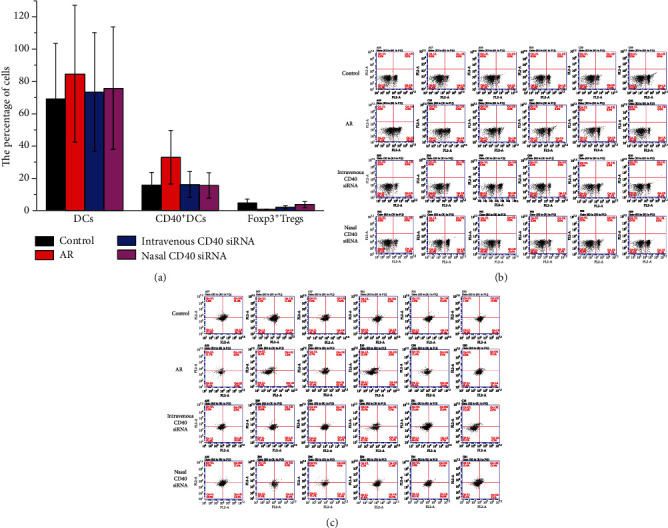
Figure 3.

(a) CD40+ DCs and Foxp3+ Tregs of the spleen in control, AR, intravenous CD40 siRNA, and nasal CD40 siRNA groups were detected by flow cytometry. CD40 expression on DCs in AR mice was higher than control group. There was no difference between AR and siRNA groups. CD40 siRNA treatment resulted in inhibition of CD40 expression on DCs. There was no significant difference between intravenous and nasal siRNA group. AR mice shown significantly less Foxp3+ Tregs, compared with control mice. Mice nasally treated with CD40 siRNA had significantly more Foxp3+ Tregs, compared with AR mice. There was no significant difference between intravenous CD40 siRNA and AR group. P values <0.05 were considered as significance. (b) CD40+ DCs of the spleen in control, AR, intravenous CD40 siRNA, and nasal CD40 siRNA groups were detected by flow cytometry. (c) Foxp3+ Tregs of the spleen in control, AR, intravenous CD40 siRNA, and nasal CD40 siRNA groups were detected by flow cytometry.
