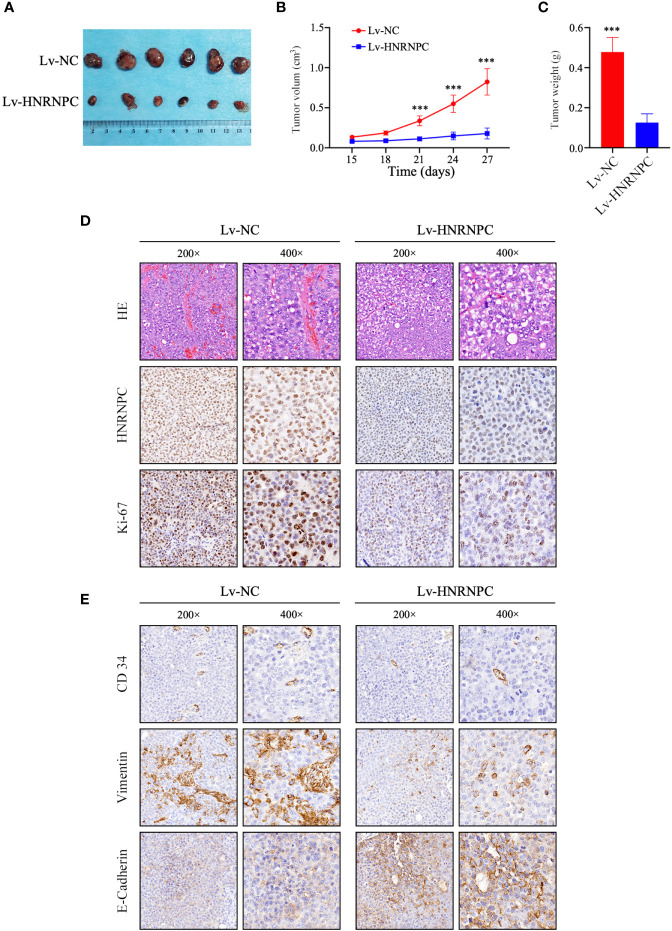
Figure 4.
HNRNPC knockdown blocked HCC cell proliferation in vivo. (A) Huh-7-cell xenograft tumors in Lv-HNRNPC and Lv-NC groups. (B, C) t-test analysis showing tumor weights and sizes in Lv-HNRNPC and Lv-NC Huh-7 cell groups. (D) H&E staining to confirm xenograft tumors (upper panel); IHC to detect HNRNPC levels in xenograft tumors (middle panel); proliferation of xenograft tumors as determined by Ki-67 staining (nether panel). (E) IHC staining to analyze CD34 (upper panel), Vimentin (middle panel), and E-Cadherin (nether panel) expression in xenograft tumors. The tumor size and weight were demonstrated as mean ± standard deviation (SD). ***P < 0.001.

