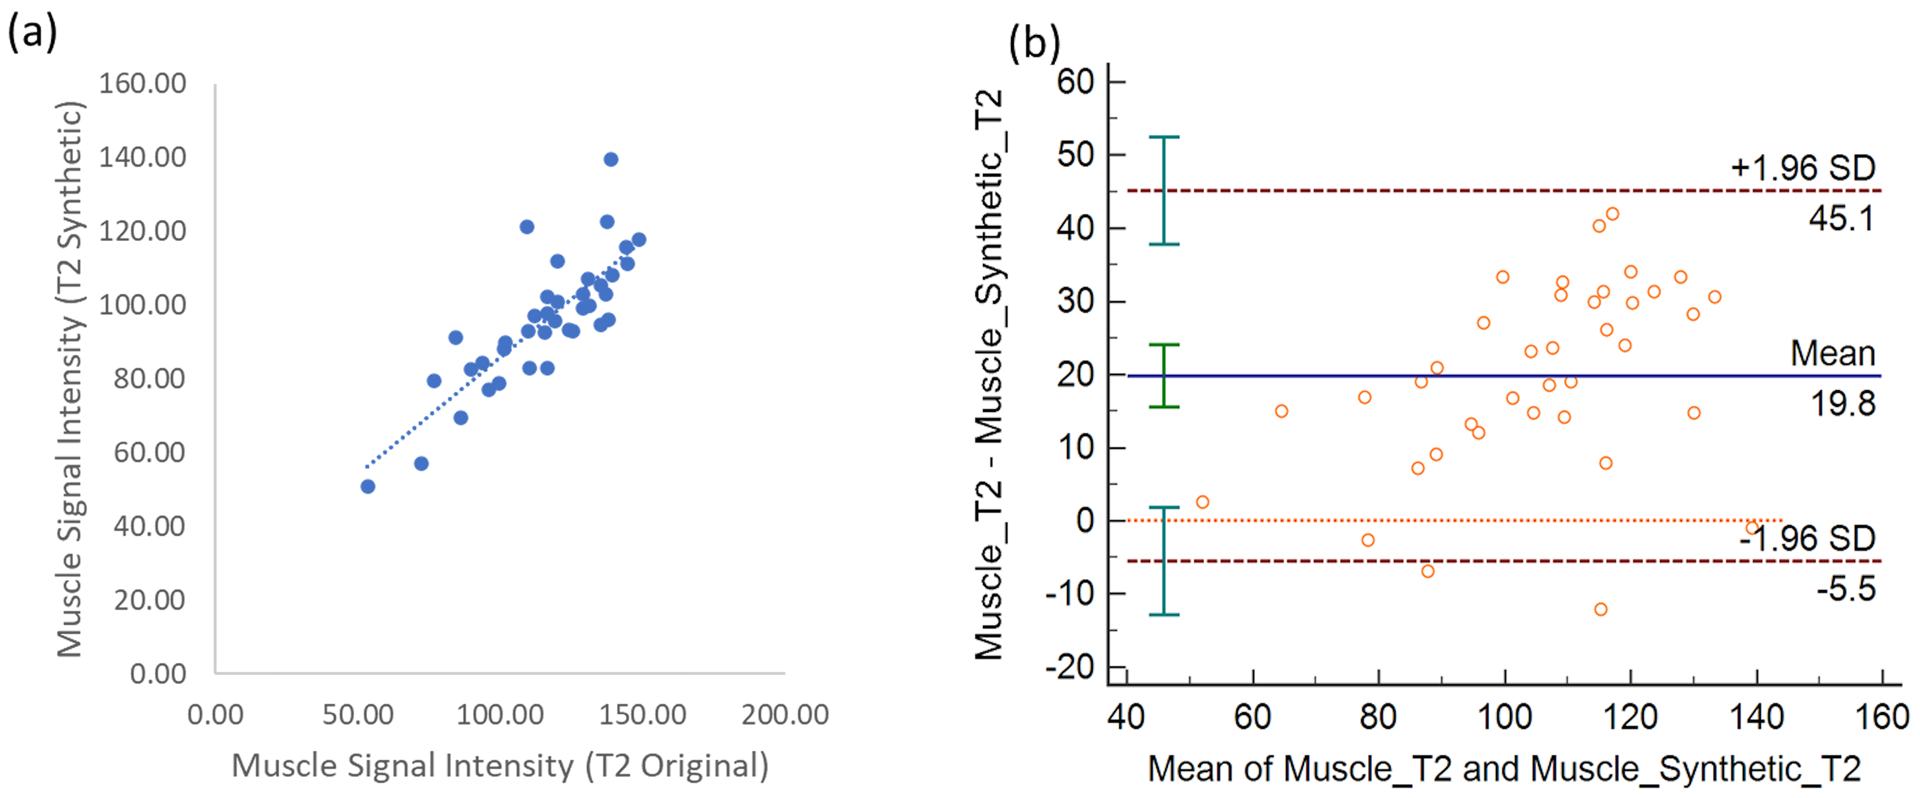
Figure 3.

(a) Scatterplot between the muscle tissue signal intensity between the original FS PD-weighted and synthetic images (AFSMRI). The Pearson correlation was obtained at 0.8 (b) Bland Altman plot between the different muscle tissue signal intensities. Bland-Altman plots demonstrating the limits of agreement of the two highly correlated T2FS-signal intensities measurements between the original MR sequence and AFSMRI deep learning (MPDL). The mean is shown by the solid horizontal line center line (19.9 and the confidence intervals (±2SD) are shown by the dotted lines.
