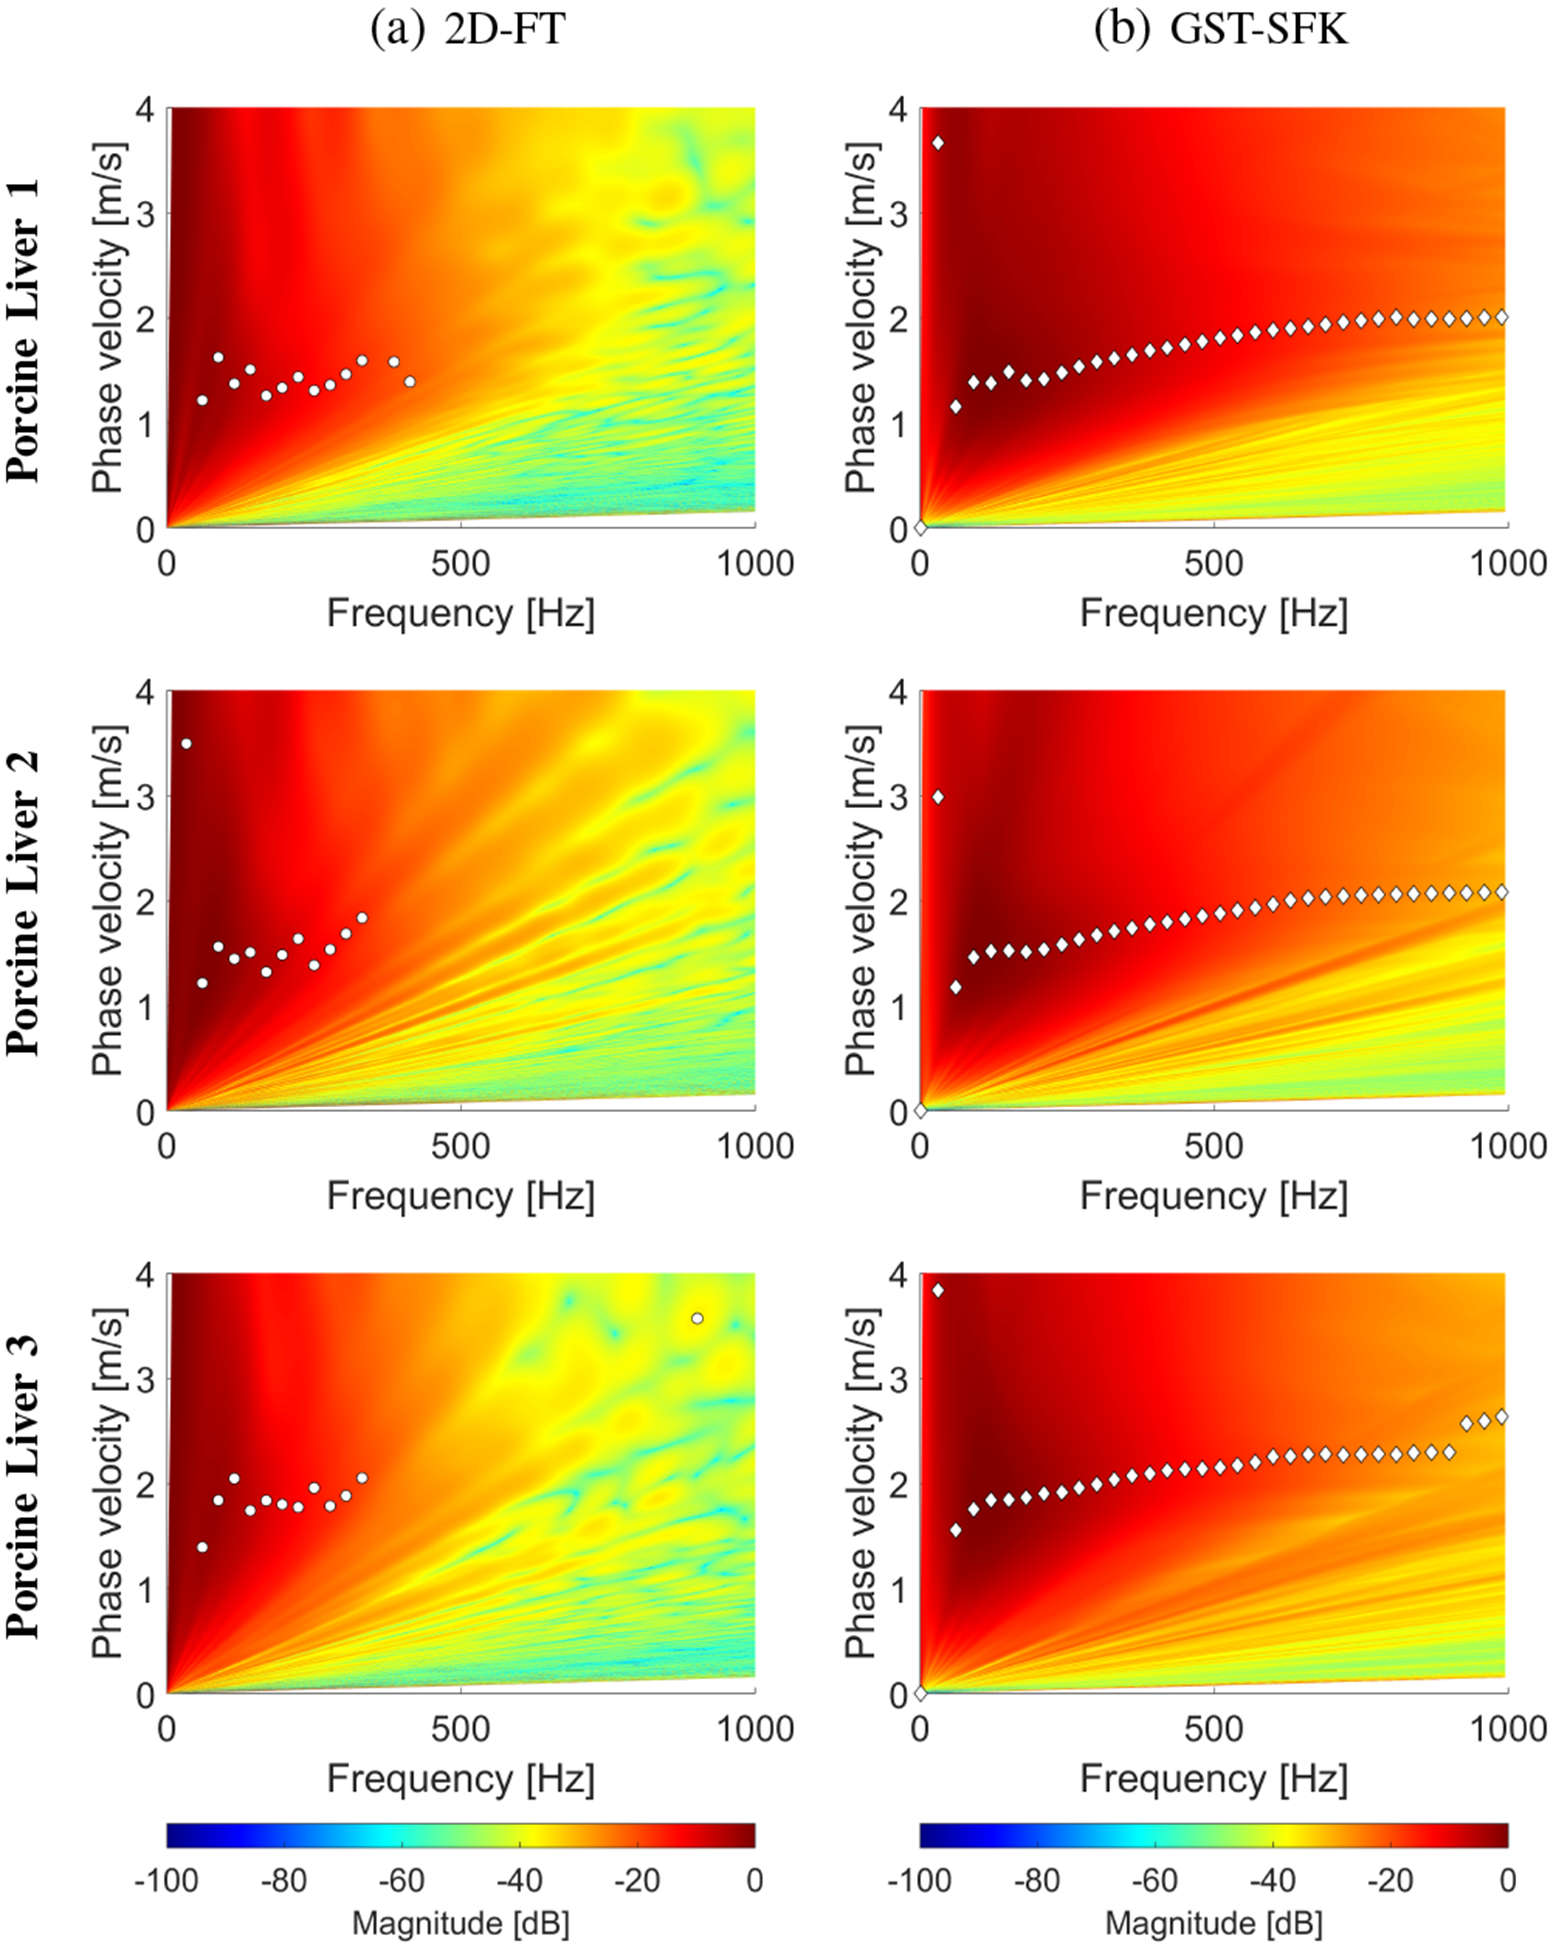
Fig. 10:

Phase velocity reconstructions based on the (a) 2D-FT, and (b) GST-SFK methods, for shear wave motion measurements. The phase velocity maps have superimposed markers corresponding to the maximum peaks of the phase velocity. Results were calculated for the experimental, ex vivo porcine liver data, for (a) Liver 1, (b) Liver 2, and (c) Liver 3.
