
Fig. 3:
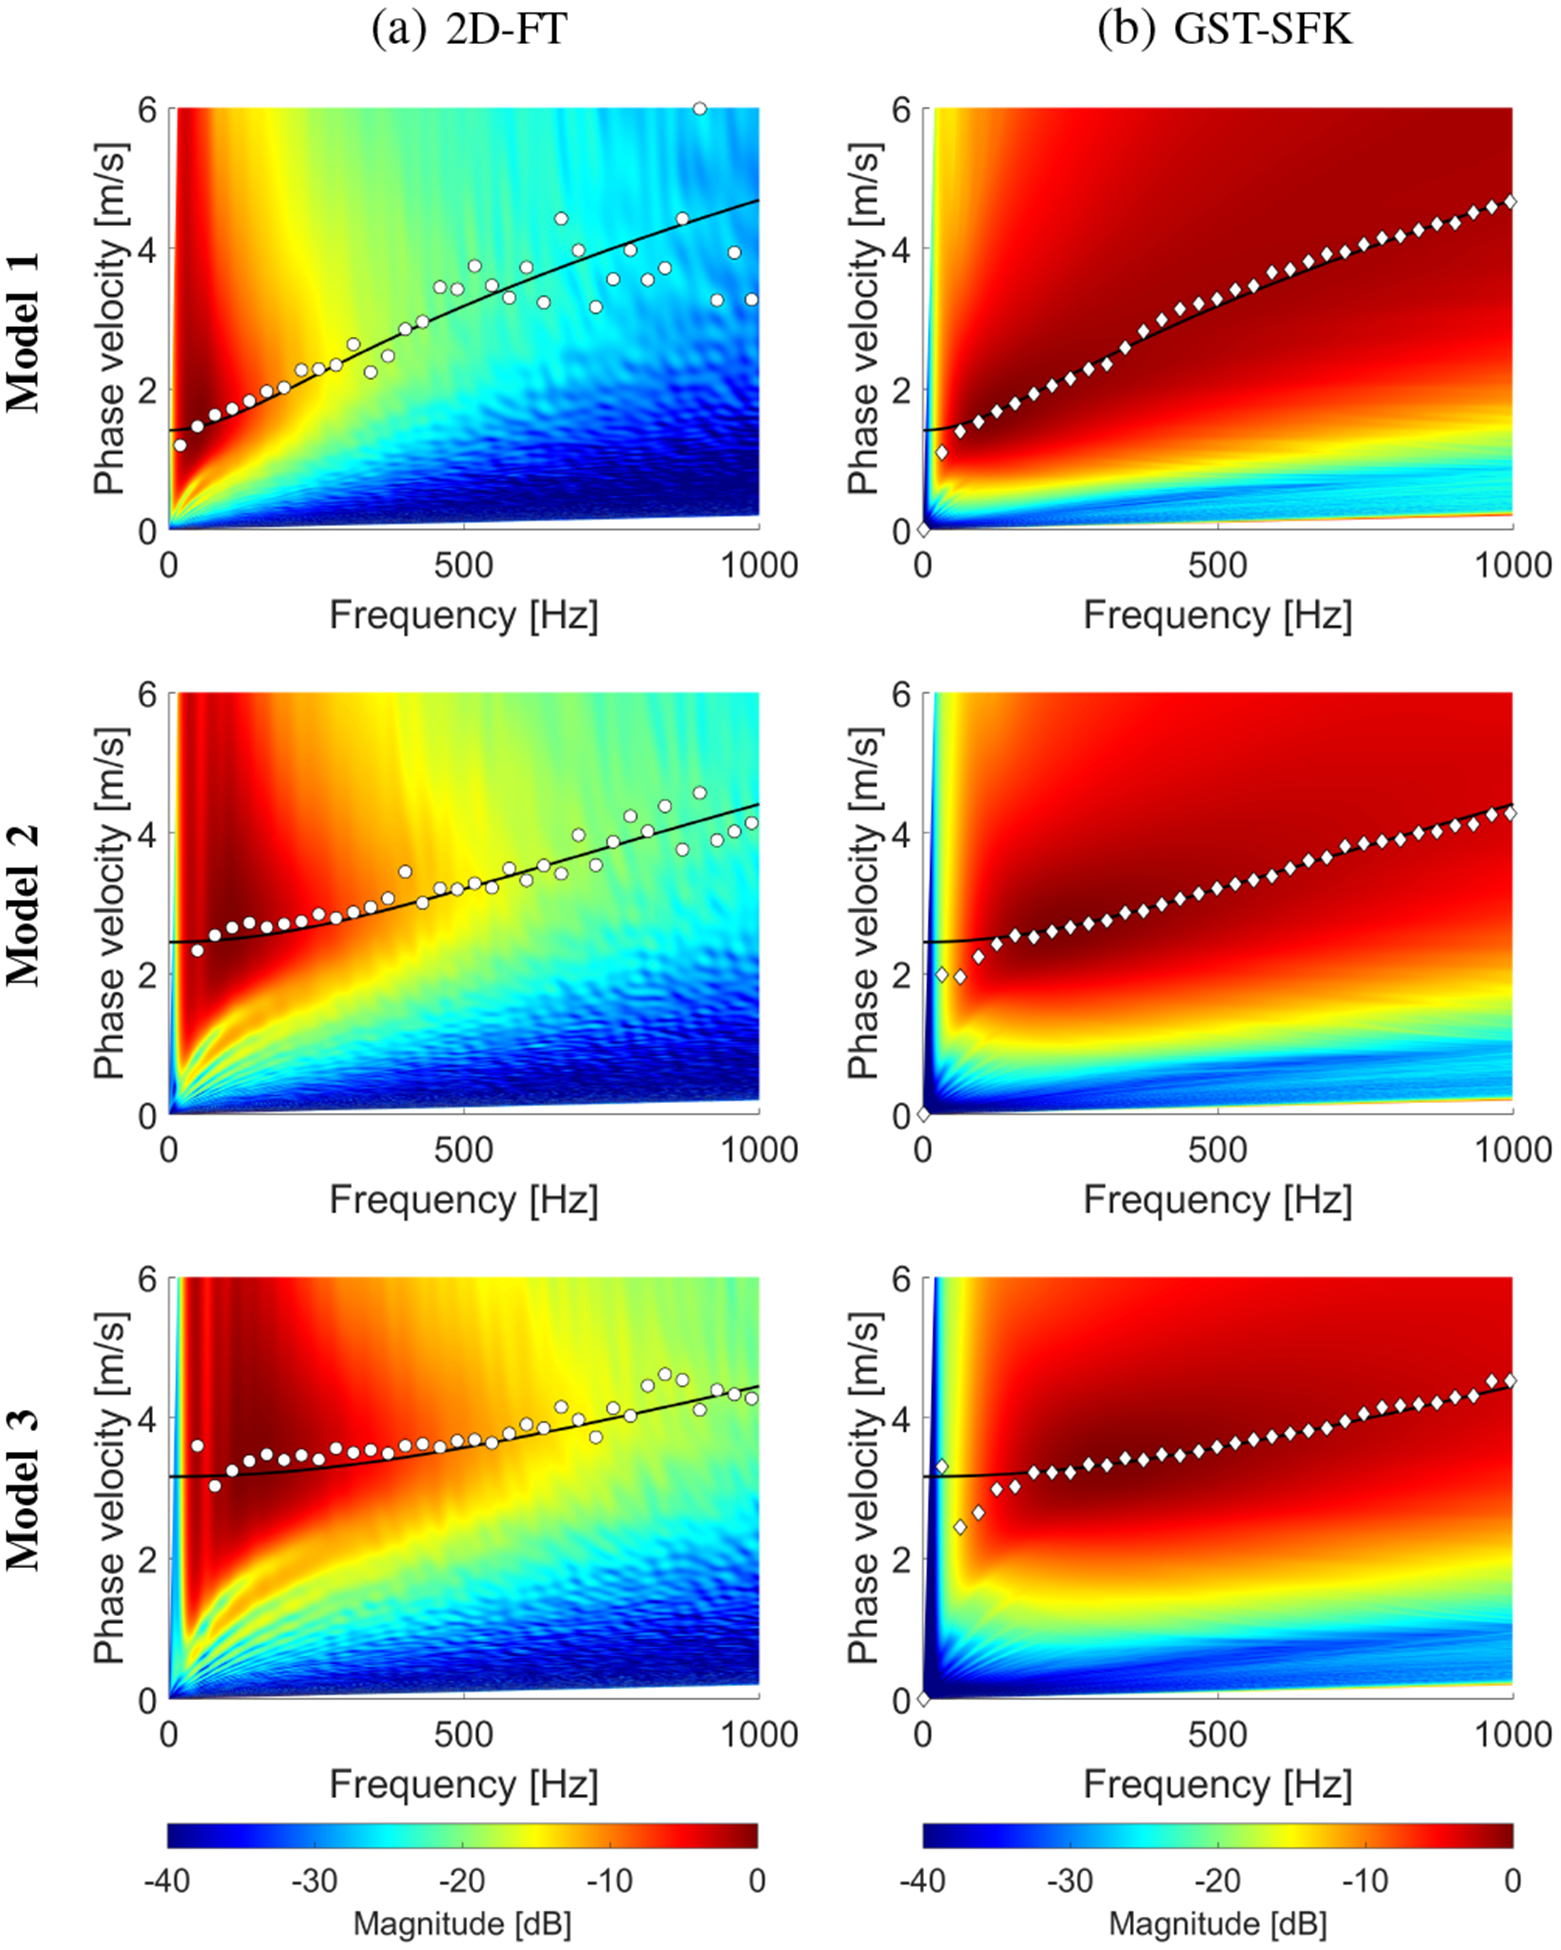
Phase velocity reconstructions based on the (a) 2D-FT, and (b) GST-SFK methods, for shear wave motion measurements. The phase velocity maps have superimposed markers corresponding to the maximum peaks of the phase velocity, as well as continuous lines which represent analytical solutions. Results were calculated for the numerical, tissue mimicking viscoelastic phantoms with a SNR of 13 dB.