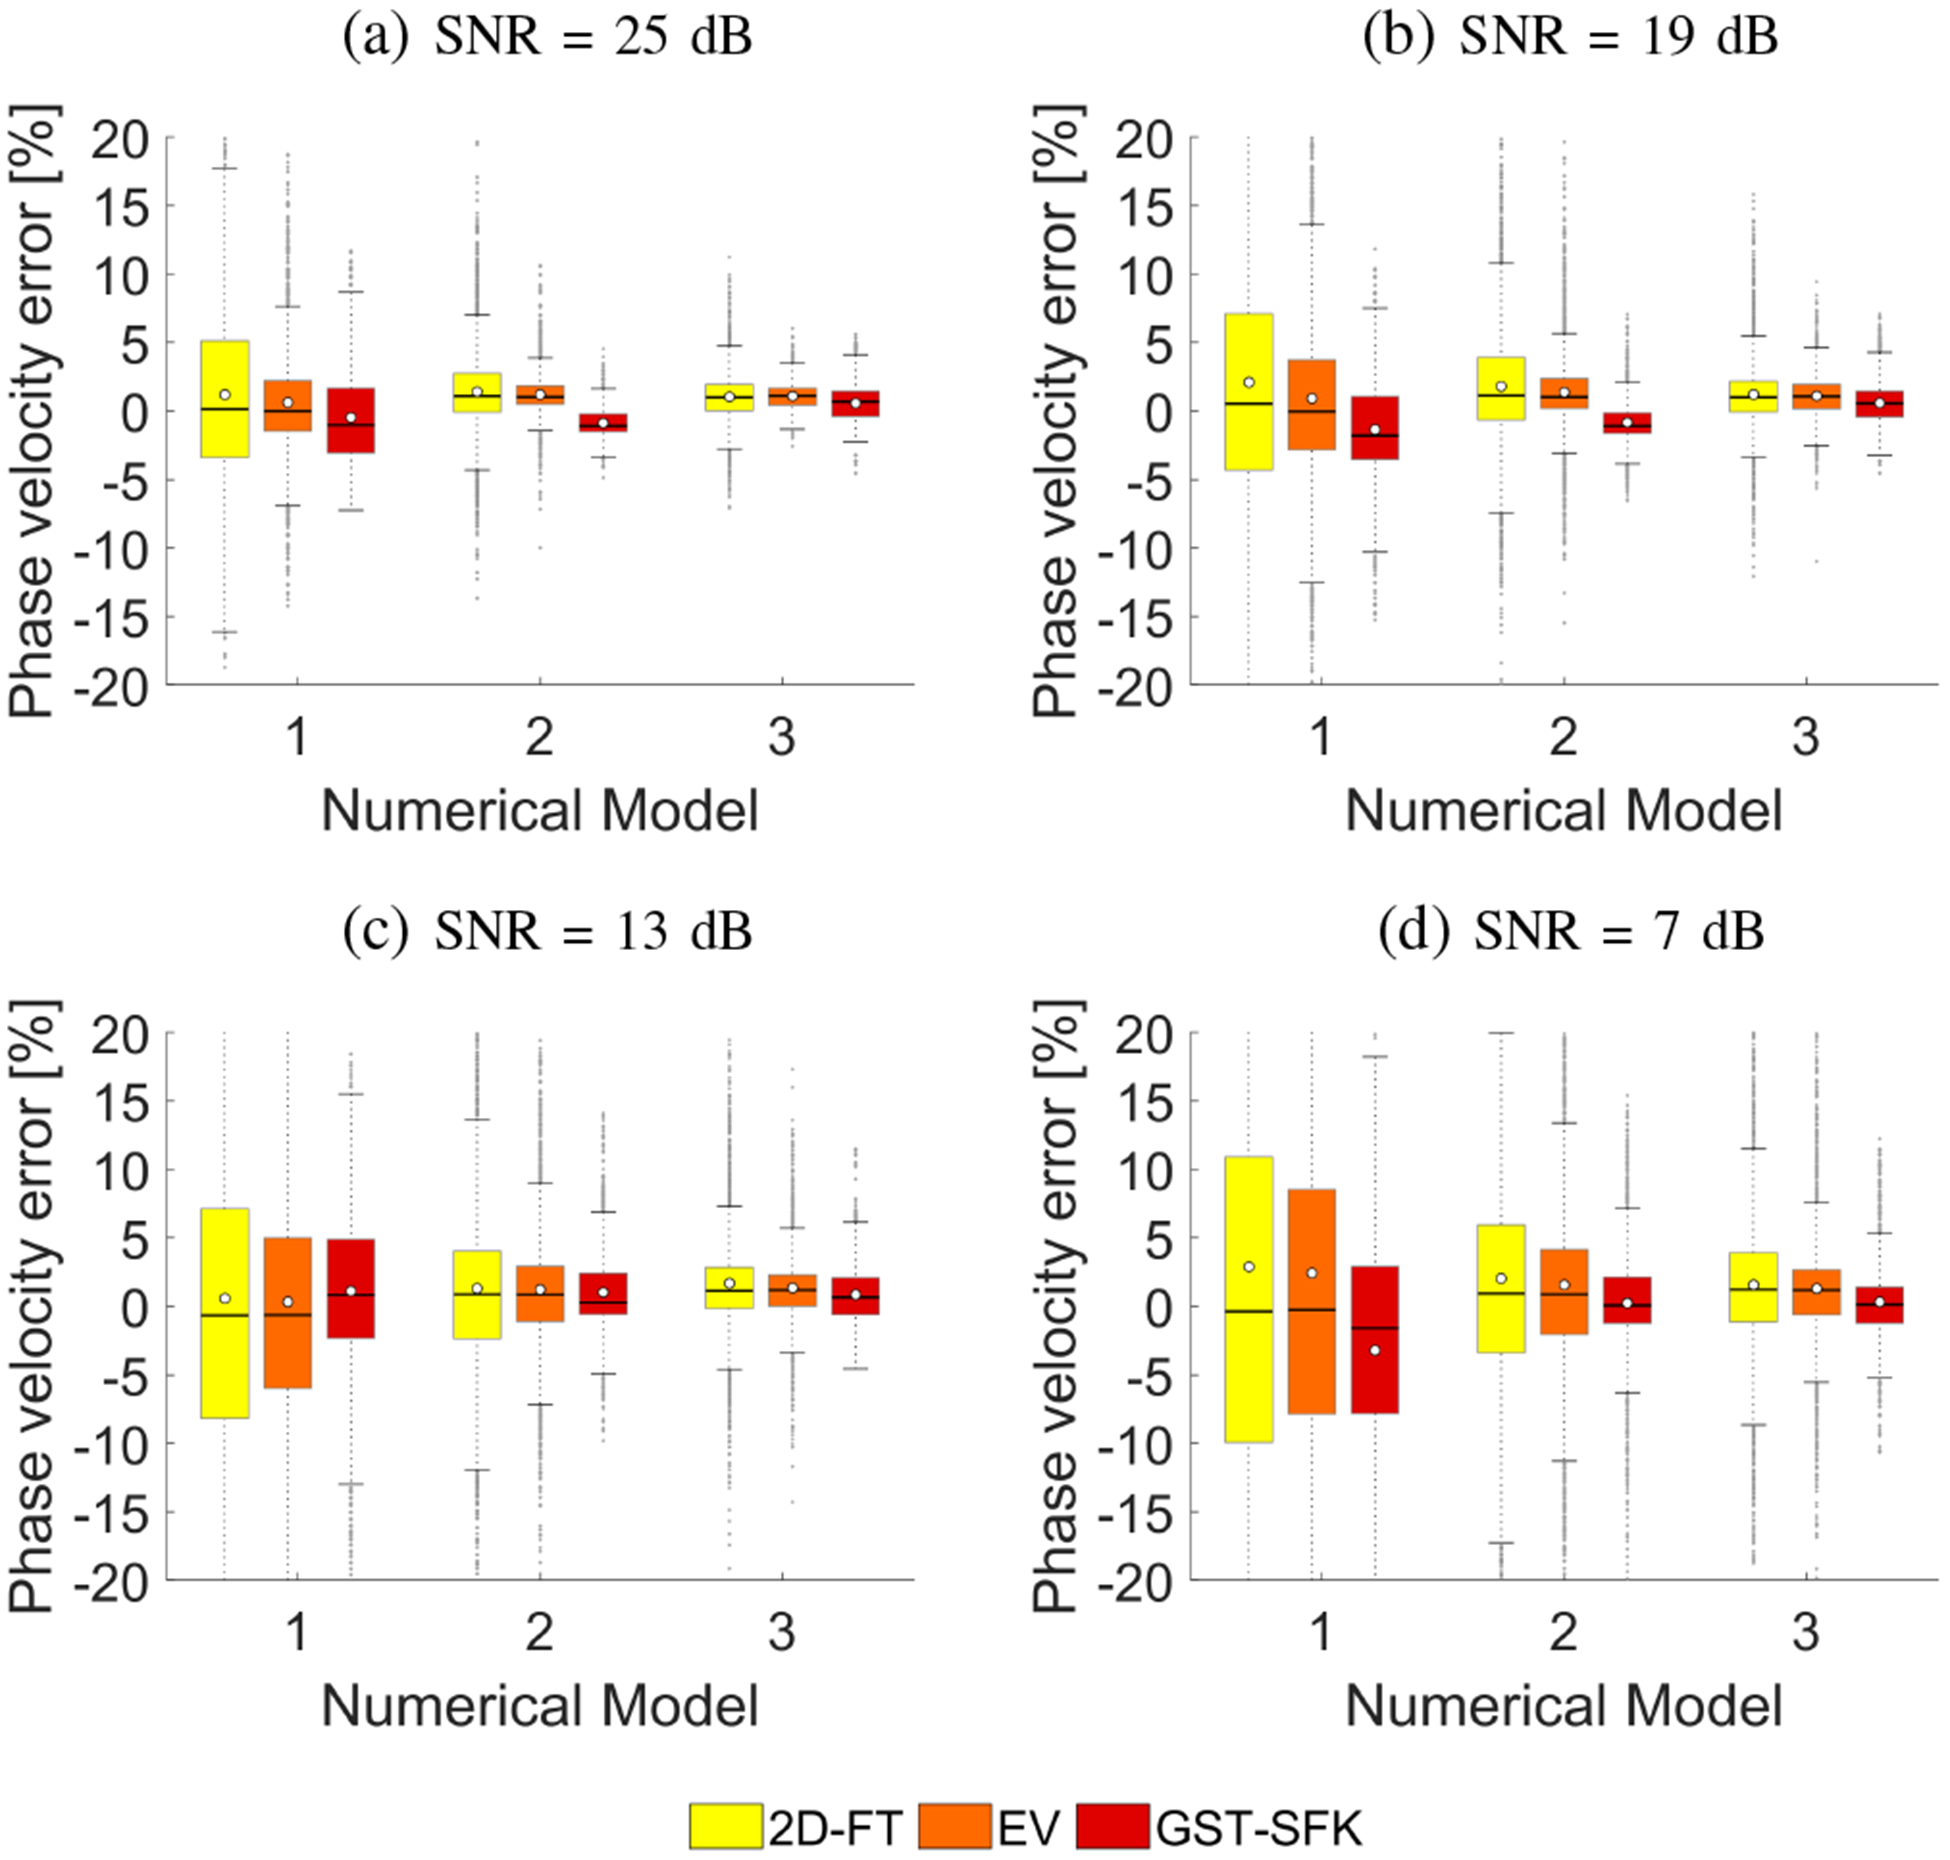
Fig. 5:

Box plots calculated for the phase velocity percent error computed in a frequency range from 200–900 Hz. Phase velocity errors were computed for the numerical finite difference data, for 30 noise realizations with SNR value set to (a) 25 dB, (b) 19 dB, (c) 13 dB, and (d) 7 dB, respectively.
