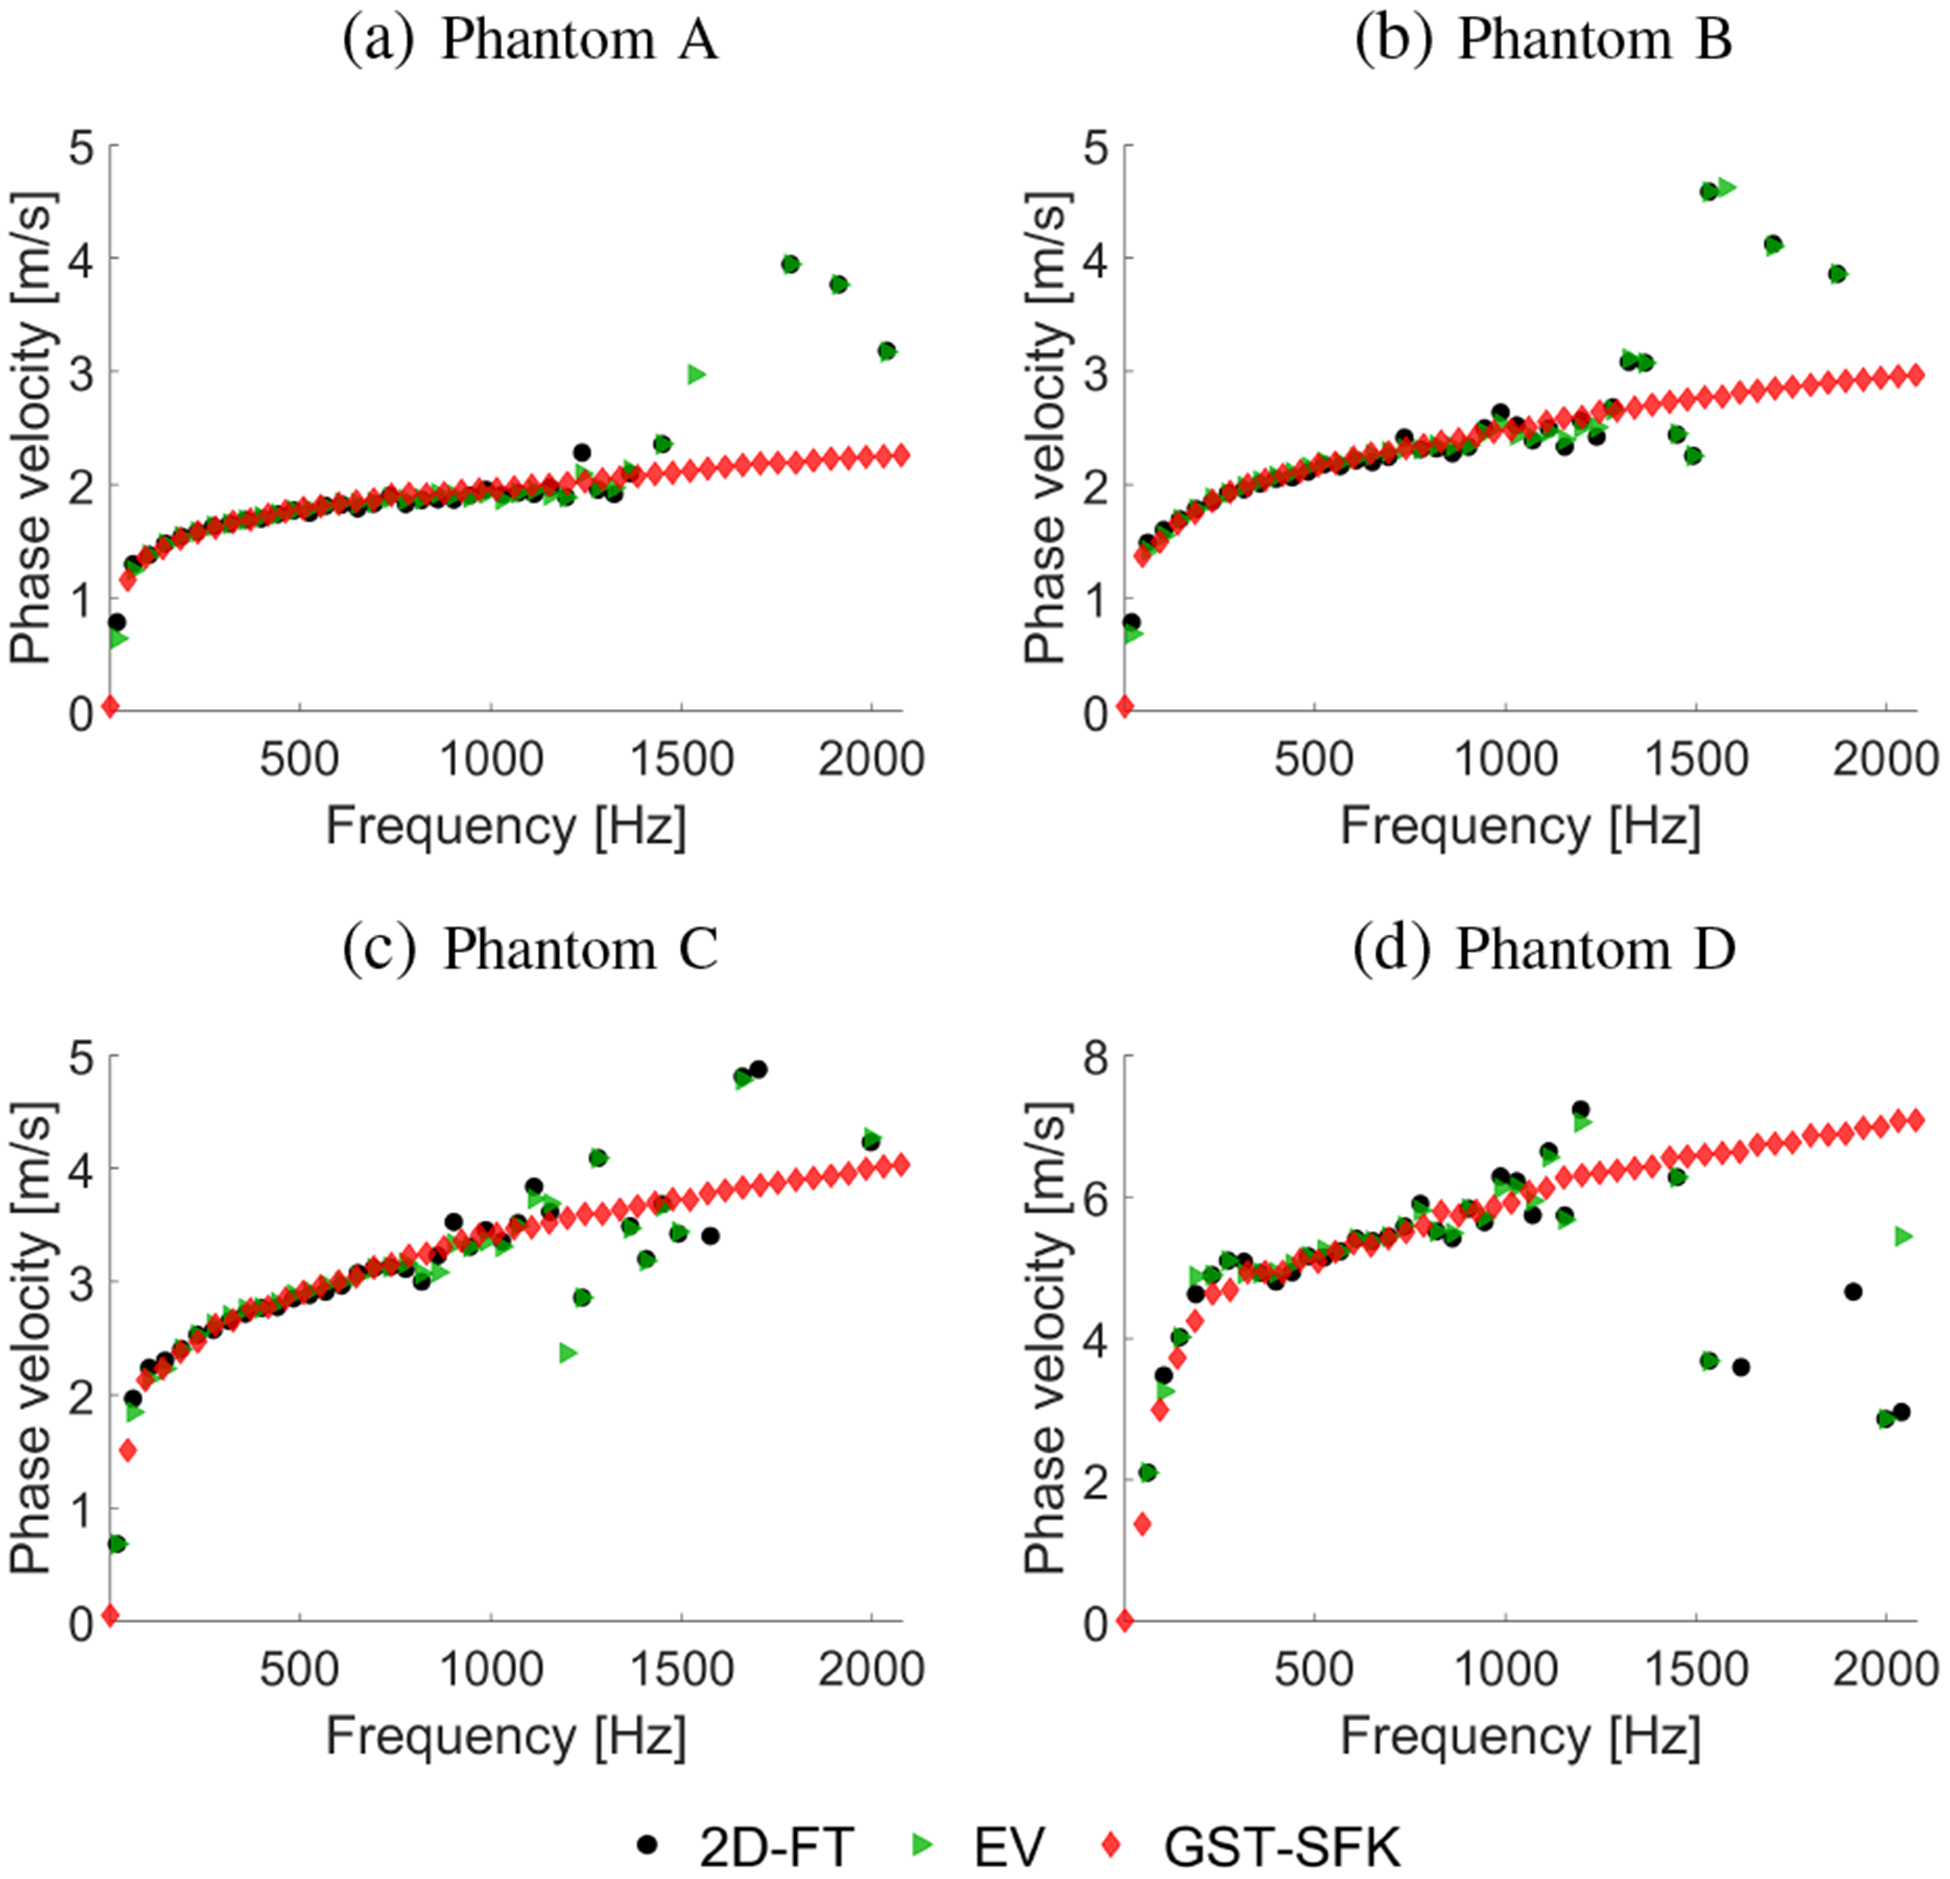
Fig. 8:

Phase velocity curves calculated for the 2D-FT (black dots), Eigenvector (green triangles), and GST-SFK (red diamonds) methods. Results were computed for the experimental, custom-made TM viscoelastic phantoms, for (a) Phantom A, (b) Phantom B, (c) Phantom C, and (d) Phantom D.
