
Figure 4. Detection of AAV abundance across tissues distributed by gender.
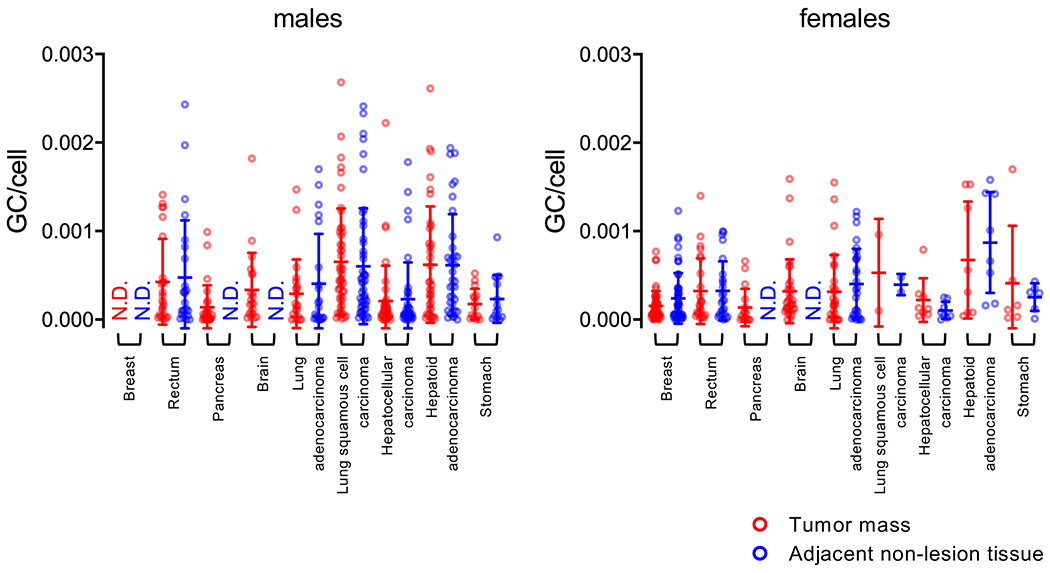
Quantification of AAV genome copy per host cell genome among positive samples in both tumor mass and adjacent non-tumor tissues. The data is partitioned by gender (males, left graph; females right graph). Each dot represents one patient tissue sample. Tumor mass (red), adjacent non-tumor tissues (blue). Means ±SD are displayed.