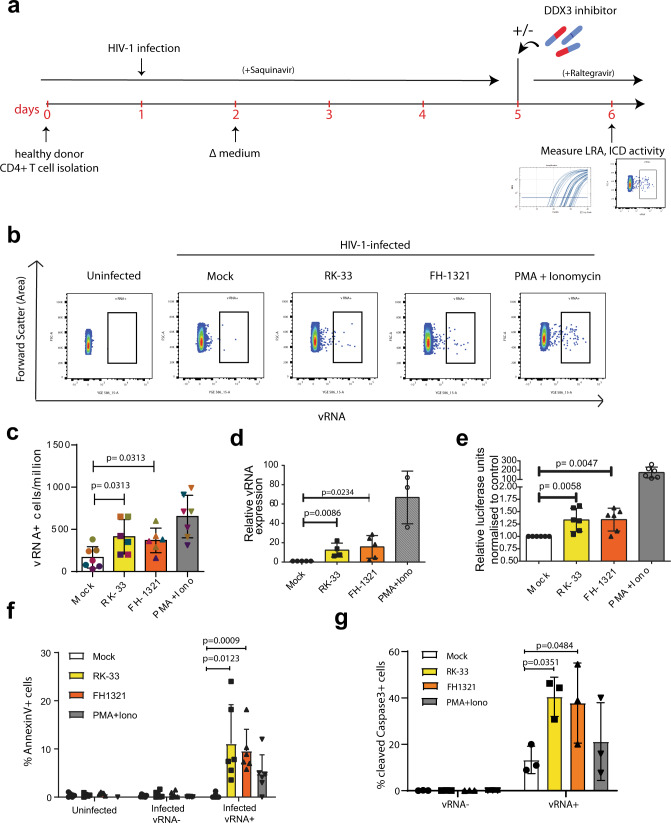
Fig. 4. DDX3 inhibition has LRA and ICD activity in a primary model of HIV-1 latency.
a Schematic for latency establishment in primary human CD4+ T cells using the Lassen and Greene model. Latent HIV-1-infected cells were treated on day 5 with DMSO (unstimulated), PMA/Ionomycin, and the DDX3 inhibitors 2 µM RK-33 and 1 µM FH-1321. Uninfected cells were used as negative control. b Representative FISH-Flow dot plots of cells as treated in a representing 50,000 cells from each condition. Gating strategy depicted in Supplementary Fig. 5a. c The frequency of vRNA-expressing cells per million as depicted in b were quantified. Individual donors are represented by the same colour and symbols represent treatments (Mock = circles, RK-33 = squares, FH-1321 = upward triangles and PMA = downward triangles). Error bars represent the mean ± SD of independent experiments using cells from six to seven different donors, with a minimum of 100,000 events acquired for each condition (paired, two-tailed, Wilcoxon test). d The relative vRNA expression levels from cells as treated in a were quantified by RT-qPCR. Error bars represent the mean ± SD of independent experiments with cells from three to five different donors (unpaired, two-tailed t-test). e Relative luciferase activity of cells as treated in a was measured and normalised to the mock-treated condition. Error bars represent the mean ± SD of independent experiments with cells from six different donors (unpaired, two-tailed t-test). f The percentages of AnnexinV positive cells from the uninfected, infected vRNA− fractions, or infected vRNA+ cells as quantified by FISH-Flow. Error bars represent the mean ± SD of independent experiments with cells from six different donors, with a minimum of 100,000 events acquired for each condition (paired, two-tailed t-test). g The percentages of cleaved Caspase-3 positive cells from the infected vRNA− fractions or infected vRNA+ cells as quantified by FISH-Flow. Error bars represent the mean ± SD of independent experiments with cells from three different donors, with a minimum of 100,000 events acquired for each condition (paired, two-tailed t-test).

