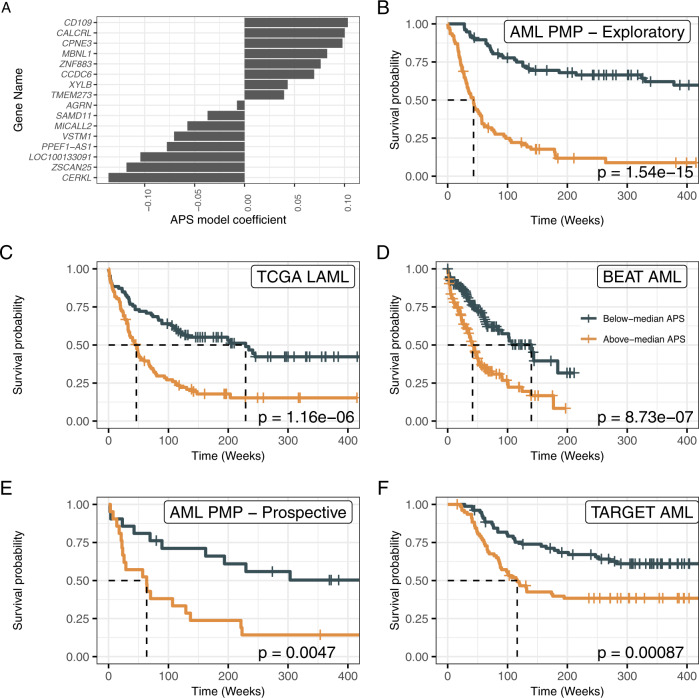
Fig. 3. Training and validation of the AML prognostic score (APS) gene expression signature.
A APS model coefficients. The y-axis indicates the genes making up the APS set, with the x-axis indicating the model coefficients. B–F Survival plots for the AML PMP (B, n = 154), TCGA LAML (C, n = 173), Beat AML (D, n = 293), AML PMP Prospective (E, n = 42), and TARGET pediatric AML (F, n = 156) cohorts, for above-median and below-median values of the APS value within each cohort. Dashed lines indicate time to median survival. Log-rank p values are indicated for each cohort.

