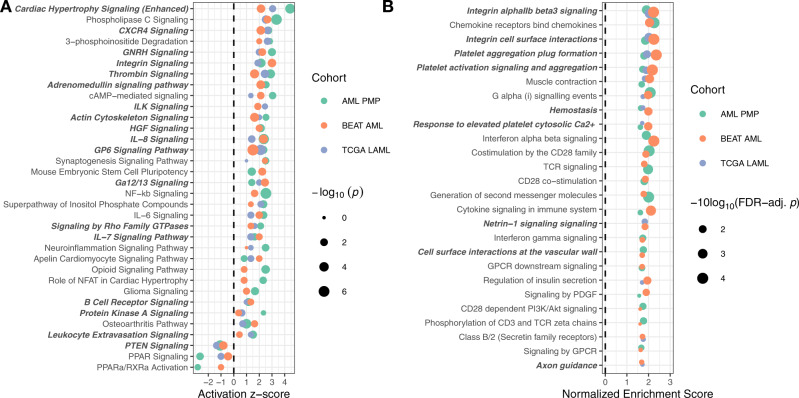
Fig. 6. Pathway enrichment analysis.
A Pathway enrichment analysis of IPA canonical pathways overrepresented in differentially expressed genes across all three cohorts. Pathways are ranked by mean activation -score, with point size scaled by Fisher’s exact test p values. B Geneset enrichment analysis (GSEA) against the Reactome pathway database. Pathways are ranked by the number of cohorts the pathway was enriched in, then by the mean FDR-adjusted p value across cohorts. GSEA p values are derived from permutation testing, and corrected for multiple testing using the FDR method. In both panels, gene sets containing PTK2 and/or ITGB3 are highlighted in bold and italic.

