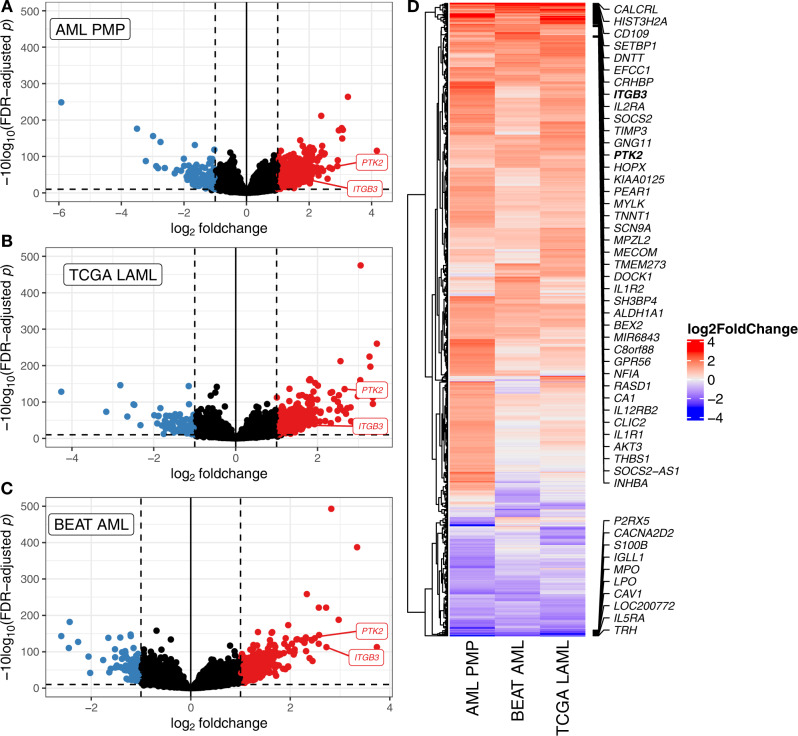
Fig. 7. Differential gene expression for patients with first-tercile vs. third-tercile APS values.
A–C Volcano plots of differentially expressed genes for the AML PMP (A), TCGA LAML (B), and Beat AML (C) cohorts. Genes with absolute log2fold-change of 1 and FDR-adjusted p ≤ 0.1 (based on Wald tests as implemented in DESeq2) are highlighted in red (over-expressed in third-tercile APS) and blue (over-expressed in first-tercile APS). D Comparison of differentially expressed genes between cohorts. All genes which were differentially expressed in any single cohort are displayed with their log2FoldChange values across all cohorts. The top 40 over-expressed and bottom ten under-expressed genes (by mean fold-change across cohorts) are labeled.

