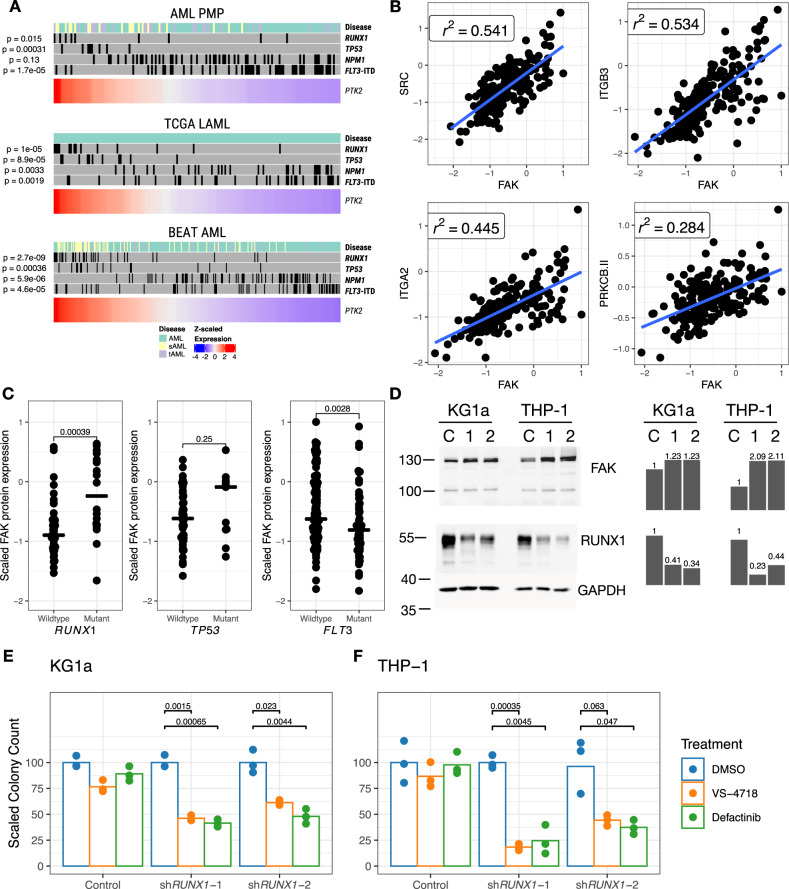
Fig. 8. Correlation of PTK2 expression with specific mutations.
A Samples from each cohort ranked by -scaled expression of PTK2. The upper annotation plot for each cohort indicates the presence of selected mutations. Indicated p values are for Kruskal-Wallis tests comparing continuous PTK2 expression against presence or absence of specific mutations. B Top highly correlated proteins with FAK. values indicate Pearson correlation coefficients. C Relative FAK protein expression in patients with and without mutant RUNX1, TP53, or FLT3 in the AML Proteome Atlas. Two-sided -test p-values are indicated for each comparison. D Western blot assessment of FAK and RUNX1 expression in KG1a and THP-1 cell line derivatives. Cell lines were treated with either (C) control shRNA, (1) shRUNX1-1, or (2) shRUNX1-2, with molecular weights quantified in kilodaltons. Quantifications scaled to controls are shown as bar plots. Each blot represents a single experiment, with the exception of RUNX1 in THP-1, which was performed twice with similar results. E, F Colony-forming cell assay for AML cell lines with short-hairpin RNAs against RUNX1, and treated with FAK inhibitors VS-4718 (0.5 μm for KG1a, 1.5 μm for THP-1) or Defactinib (1 μm for both cell lines). The indicated p values correspond to two-sided -tests for each comparison.

