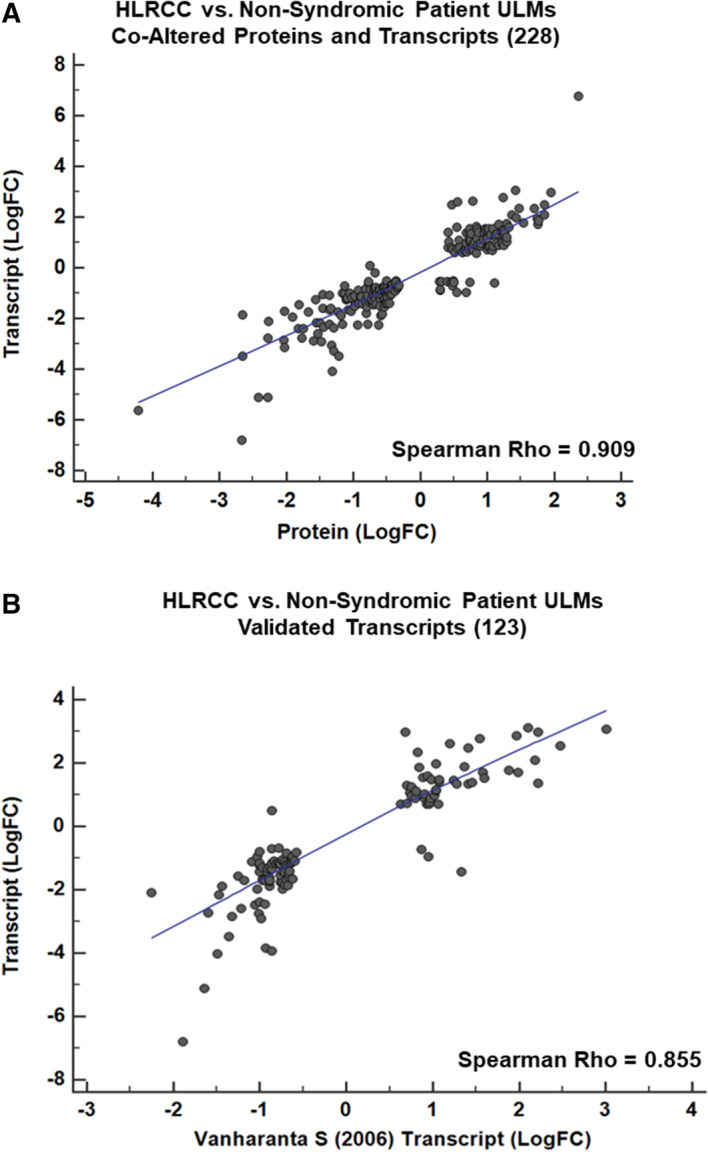
Figure 5.

Correlation plot of co-altered proteins, transcripts and validated transcript alterations in Hereditary Leiomyomatosis and Renal Cell Cancer (HLRCC) and non-syndromic (NS) patients. (A) Correlation plot reflects 228 co-altered proteins and transcripts significantly altered between HLRCC and NS ULMs (Spearman Rho = 0.909, MWU p < 0.0001). (B) Correlation plot reflects 123 transcripts co-altered in our dataset and Vanharanta et al.20 (Spearman Rho = 0.855, MWU p < 0.0001).
