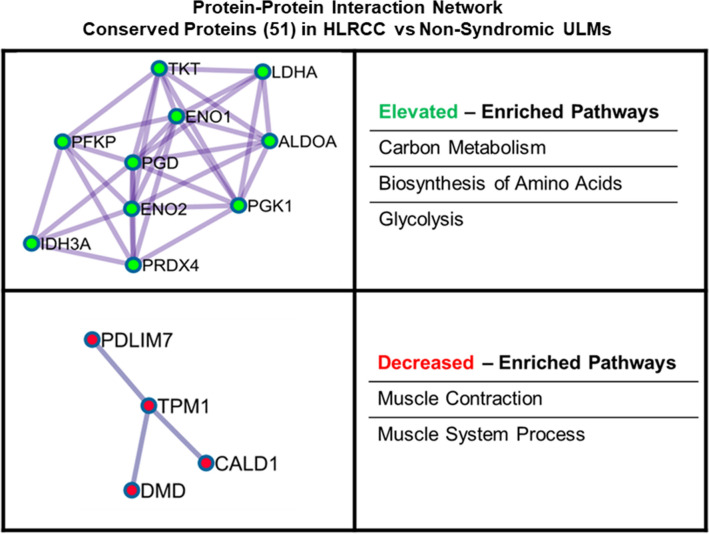
Figure 6.
Protein interaction network enriched from validated transcripts confirmed at the protein-level as altered between HLRCC versus non-syndromic (NS) ULMs. Validated transcripts confirmed at the protein level (51 total) were analyzed using MetaScape51 and resulting protein–protein interaction networks enriched by proteins elevated (highlighted in green) or decreased (heighted in red) in HLRCC vs NS ULMs were assembled using Cytoscape52. The top pathways enriched by network proteins are also noted.

