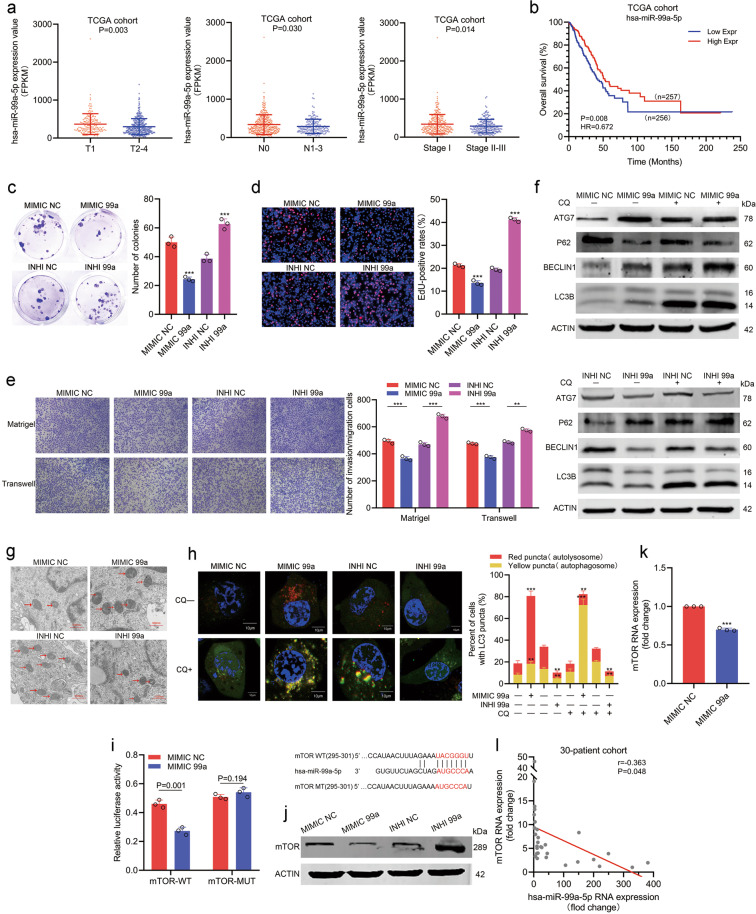
Fig. 6. miR-99a restrains progression and promotes autophagy by targeting mTOR.
a miR-99a expression was downregulated at higher T stage (left panel, P = 0.003), N stage (middle panel, P = 0.030) or TNM stage (right panel, P = 0.014) in the TCGA cohort. b Kaplan–Meier analysis of the overall survival in the TCGA cohort based on miR-99a (HR = 0.672, P = 0.008). c, d miR-99a inhibited the proliferation ability of H1299 cells, as shown by colony formation assays (c) and EdU assays (d). e miR-99a inhibited the migration and invasion abilities of H1299 cells, as shown by transwell and Matrigel assays. f–h miR-99a promoted autophagy in H1299 cells, as shown by WB assays (f), TEM (g), and autophagic flux (h). i The schematic diagram of the binding site of mTOR and miR-99a which was predicted by TargetScan (http://www.targetscan.org/vert_72/), and the schematic diagram of wild type or mutant mTOR sequence used for dual luciferase reporter assays. Dual luciferase reporter assays indicated that miR-99a directly binds to the 3’-UTR of mTOR (P = 0.001). j Western blot analysis indicated the change in mTOR expression level in H1299 cells transfected with miR-99a mimics or inhibitors. k qRT-PCR showed that miR-99a overexpression decreased the mRNA expression of mTOR in H1299 cells (P < 0.001). l Correlation between miR-99a expression and mTOR expression in the 30-patient cohort (r = −0.363, P = 0.048). All experiments were repeated three times with similar results and images are representative of three independent experiments. A two-tailed Student’s t-test was used for statistical analysis. *P < 0.05, **P < 0.01, ***P < 0.001, n.s. not statistically significant. Error bars, SEM.

