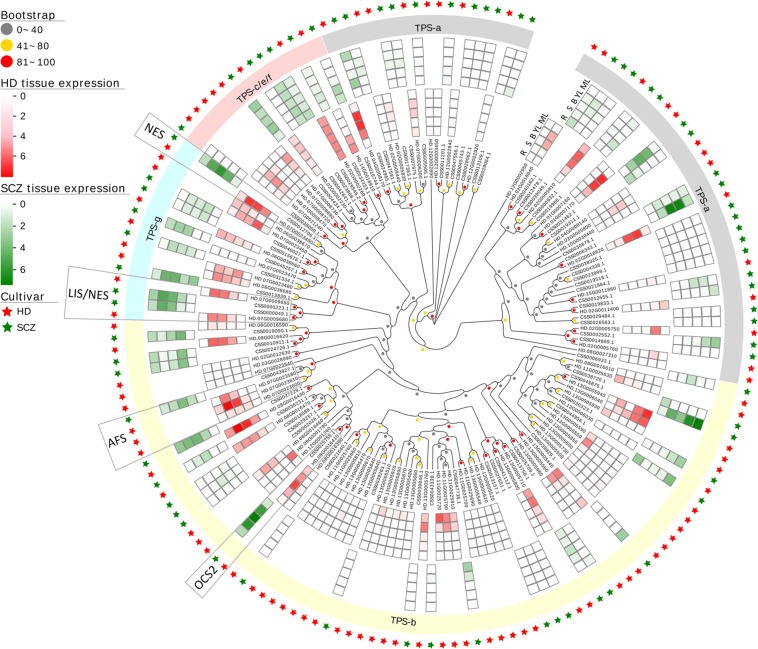
Fig. 6. Phylogenetic and tissue expression analysis of TPS genes from HD and SCZ.
The legends are shown on the left. The TPM values of five tissues (root, stem, apical bud, young leaf, and mature leaf) from HD and SCZ were normalized. Four homologous TPS genes, including linalool and (E)-nerolidol synthase (LIS/NES)34, (E)-nerolidol synthase (NES)35, α-farnesene synthase (AFS)36, and ocimene synthase 2 (OCS2)37, that have been identified in vitro or in vivo are marked

