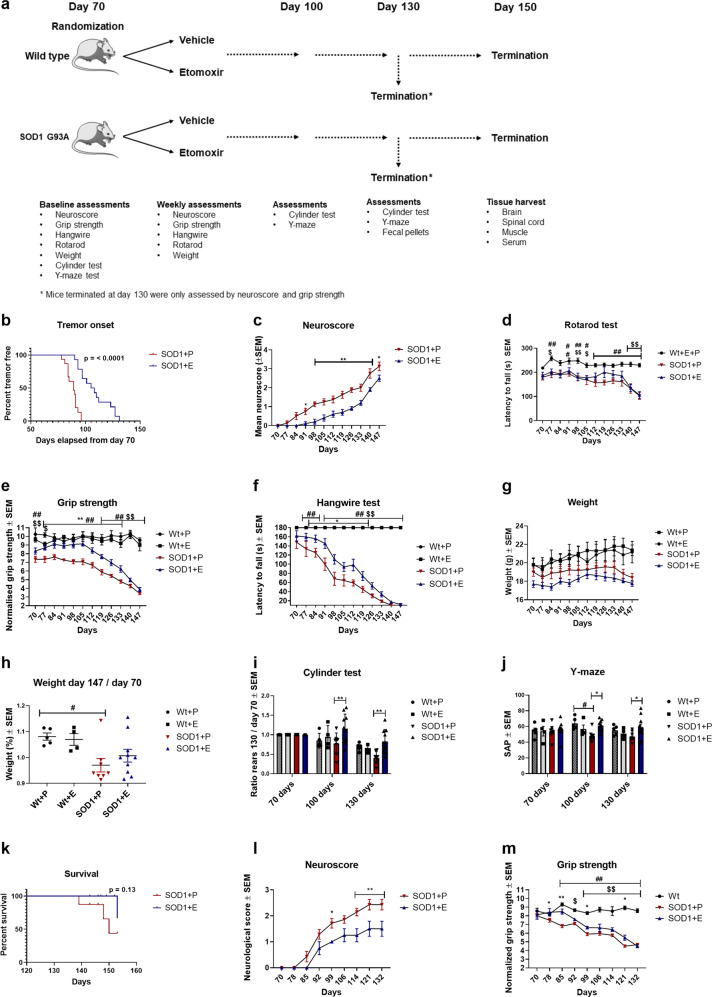
Fig. 1. Downregulating CPT1 by etomoxir ameliorate clinical symptoms and delays disease progression in the SOD1 G93A mouse model.
a Experimental setup, mice were randomized into treatment with etomoxir or placebo at approximately day 70 (baseline) and tested weekly until day. b Time point for onset of disease defined as visible tremor in hindlimbs (n = 11–15), log-rank survival analysis. c Neuroscore was assessed once a week. Mean neuroscore ± SEM (n = 8–10). d Rotarod test was performed once a week. Mean latency to fall ± SEM (n = 4–7). e Grip strength was measured once a week from day 70. Data are presented as mean normalized strength ± SEM (n = 4–10). f Hangwire test was performed once a week. Mean latency to fall of the grid ± SEM (n = 4–10). g Mean body weight expressed in grams ± SEM (n = 4–10). h Mean body weight ratio at day 147 compared to baseline ± SEM (n = 4–10), one-way ANOVA with Tukey post hoc test. i Cylinder test was performed at day 70, 100, and 130. Mean ratio rears between day 100, 130, and baseline ± SEM (n = 4–10). j Y-maze test was conducted at day 70, 100, and 130. Mean spontaneous alternation percentage ± SEM (n = 4–10). k Survival was defined as neuroscore below 4, (n = 8–10), log-rank survival analysis. If nothing else is noted, data was analyzed using repeated measure two-way ANOVA followed by Tukey post hoc test. l Mean neuroscore for SOD1 mice treated from day 70 and until day 130 ± SEM (n = 4–7). m Mean normalized grip strength for SOD1 mice treated from day 70 and until day 130 ± SEM (n = 4–7). Data are representative of three experiments. Repeated measure two-way ANOVA with Tukey post hoc test was performed if nothing else is stated. *Significant differences between SOD1 + E and SOD1 + P, #significant differences between SOD1 G93A + P and Wt, $significant differences between SOD1 + E and Wt. *p ≤ 0.05; **p ≤ 0.01; #p ≤ 0.05; ##p ≤ 0.01; $p ≤ 0.05; $$p ≤ 0.01 WT = wild-type, SOD1 = SOD1 G93A genotype, E = etomoxir, P = placebo. Mouse figure used in experimental setup figures were obtained from; https://smart.servier.com/ and used according to the Creative Commons Attribution 3.0 Unsupported License.

