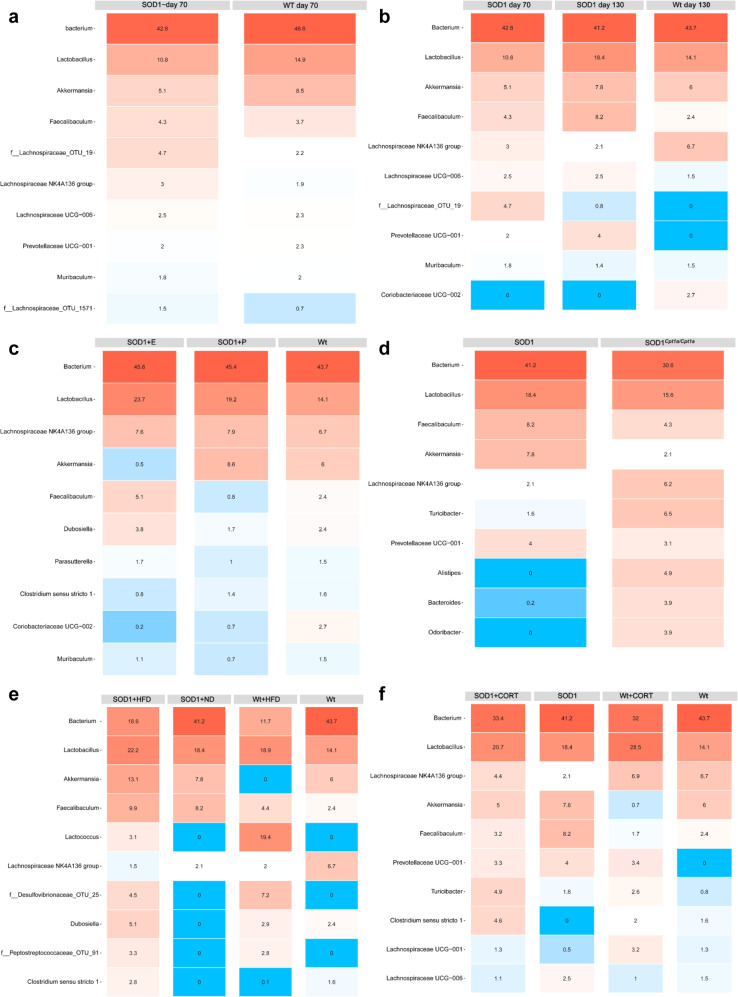
Fig. 10. Modulation if CPT1 activity by etomoxir, genetic inhibition, high-fat diet, and corticosterone modulates the gut microbiota in SOD1 G93A mice.
a Heatmap illustrating the ten most abundant communities at the genus level in fecal samples from SOD1 mice and Wt mice at day 70. Values represents mean relative abundancy. b Heatmap illustrating the ten most abundant communities at the genus level in fecal samples from SOD1 mice at day 70, day 130, and Wt mice at day 130. Values represents mean relative abundancy. c Heatmap illustrating the ten most abundant communities at the genus level in fecal samples from SOD1 + P, SOD1 + E, and Wt mice at day 130. Values represents mean relative abundancy. d Heatmap illustrating the ten most abundant communities at the genus level in fecal samples from SOD1 and SOD1Cpt1a/Cpt1a mice at day 130. Values represents mean relative abundancy. e Heatmap illustrating the ten most abundant communities at the genus level in fecal samples from SOD1 + ND, SOD1 + HFD, Wt+ND, and Wt+HFD mice at day 130. Values represents mean relative abundancy. f Heatmap illustrating the ten most abundant communities at the genus level in fecal samples from SOD1, SOD1 + CORT, Wt, and Wt+CORT mice at day 130. Values represents mean relative abundancy. Fecal pellet samples were harvested at day 70 or day 130, n = 4–5. Data are representative of one 16S rRNA sequencing experiment. Wt = wildtype, SOD1 = SOD1 G93A genotype, SOD1Cpt1a/Cpt1a = SOD1 G93A mice with homozygote Cpt1a p479l mutation. E = etomoxir, P = placebo, HFD = high-fat diet, CORT = corticosterone.

