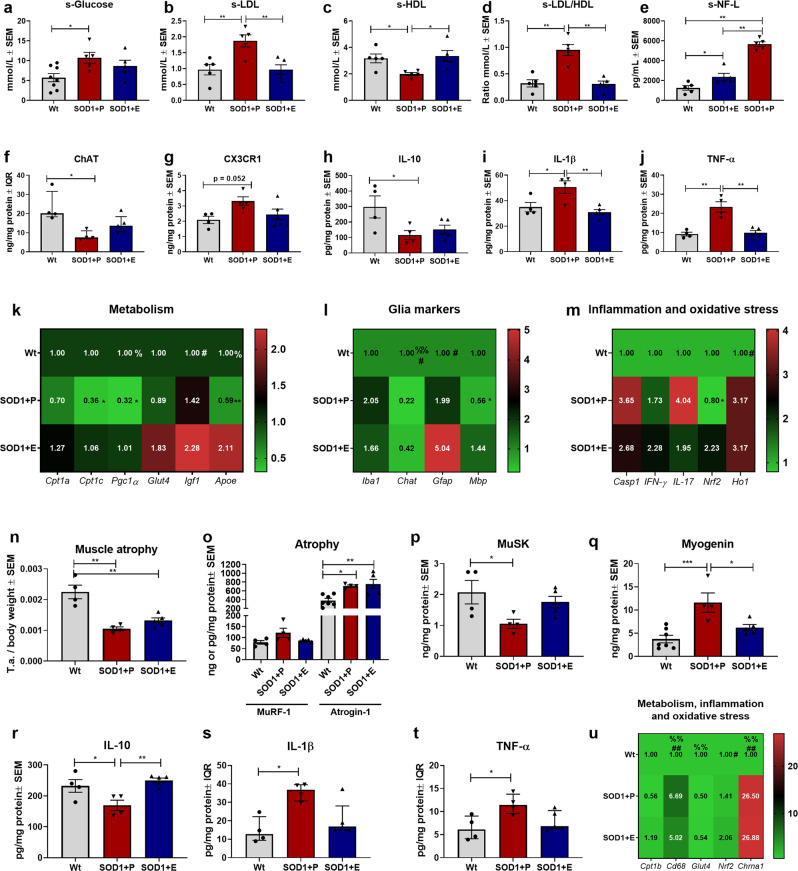
Fig. 2. Downregulation of CPT1 activity by etomoxir potentially shifts metabolism towards glucose utilization and ameliorate disease mechanisms, including inflammation, mitochondrial dysfunction, and oxidative stress.
a Serum glucose levels. Mean mmol/L ± SEM. b Serum LDL levels. Mean mmol/L ± SEM. c Serum HDL levels. Mean mmol/L ± SEM. d Serum LDL/HDL ratio levels. Mean mmol/L ratio ± SEM. e Serum NF-L levels. Mean pg/mL ± SEM, f ChAT levels in lumbar spinal cord tissue homogenate. Median ng/mg total protein ± IQR. g CX3CR1 levels in lumbar spinal cord tissue homogenate. Mean ng/mg total protein ± SEM. h IL-10 levels in lumbar spinal cord tissue homogenate. Mean pg/mg total protein ± SEM. i IL-1β levels in lumbar spinal cord tissue homogenate. Mean pg/mg total protein ± SEM. j TNF-α levels in lumbar spinal cord tissue homogenate. Mean pg/mg total protein ± SEM. k–m Fold-change gene expression of metabolic, glial, inflammatory and oxidative stress genes in lumbar spinal cord tissue. Mean normalized fold-change gene expression ± SEM. n Weight of tibialis anterior muscle at termination. Weight of tissue were normalized to body weight and expressed as mean ± SEM. o MuRF1 and atrogin-1 levels in tibialis anterior tissue homogenate. Mean ng/mg total protein ± SEM. p MuSK levels in tibialis anterior tissue homogenate. Mean ng/mg total protein ± SEM. q Myogenin levels in tibialis anterior tissue homogenate. Mean ng/mg total protein ± SEM. r IL-10 levels in tibialis anterior tissue homogenate. Mean pg/mg total protein ± SEM. s IL-1β levels in tibialis anterior tissue homogenate. Mean pg/mg total protein ± SEM. t TNF-α levels in tibialis anterior tissue homogenate. Mean pg/mg total protein ± SEM. u Fold-change gene expression of metabolic, inflammatory, oxidative stress and denervation genes in tibialis anterior tissue homogenate. Mean normalized fold-change gene expression ± SEM. Serum samples and tissue were obtained at termination. All data was analyzed using one-way ANOVA followed by Tukey post hoc test or Kruskal–Wallis test followed by Dunns post hoc test. N = 5–8 for serum analysis and 3–5 for all other experiments. Data are representative of one experiment. Gene expression was normalized to β-actin and Gapdh. *Significant differences between groups in all analyses except gene expression experiments. *p ≤ 0.05; **p ≤ 0.01. Significant annotations in gene expression experiments (one sign = p ≤ 0.05, two signs = p ≤ 0.01). * = SOD1 + P vs. SOD1 + E, % = Wt+P vs. SOD1 + P, # = Wt+P vs. SOD1 + E. Wt = wildtype, SOD1 = SOD1 G93A genotype, E = etomoxir, P = placebo, SEM = standard error of mean, IQR = interquartile range, LDL = low-density lipoproteins, HDL = High-density lipoproteins, NF-L = Neurofilament light-chain, ChAT = Choline o-acetyltransferase, MuSK = Muscle skeletal receptor tyrosine-protein kinase, MuRF1 = Muscle RING-finger protein-1.

