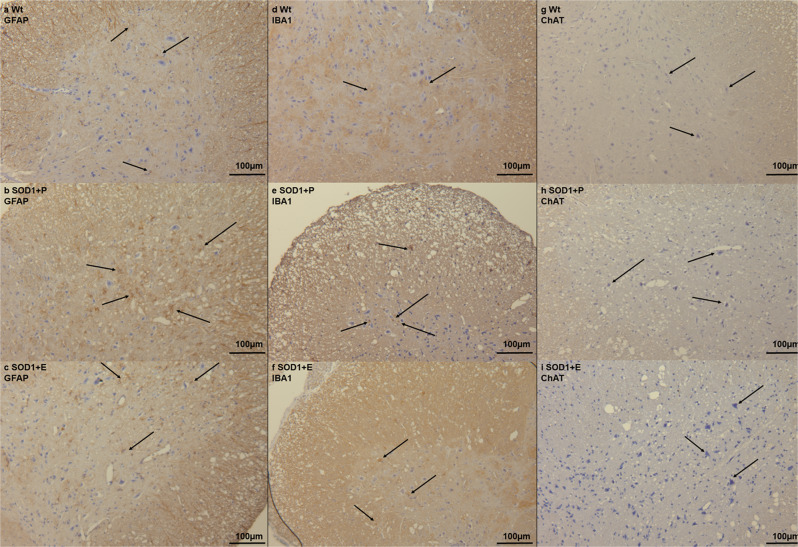
Fig. 4. Immunohistochemical staining in the lumbar spinal from the SOD1 G93A etomoxir experiment.
a–c GFAP staining in lumbar spinal cord from Wt, SOD1 + P and SOD1 + E mice at day 130 indicating increased number of reactive astrocytes in the ventral horn in SOD1 + P mice (arrows) compared to Wt and SOD1 + E mice. d–f IBA1 staining in lumbar spinal cord from Wt, SOD1 + P and SOD1 + E mice at day 130, indicating increased labeling and infiltration of reactive microglia in the ventral horn in SOD1 + P mice (arrows) compared to SOD1 + E and Wt mice. g–i ChAT staining in lumbar spinal cord from Wt, SOD1 + P and SOD1 + E mice at day 130 indicating decreased labeling in SOD1 + P mice (arrows) and pathological morphology of neurons. All images are presented with x16 magnification. N = 2–4 animals per group. WT = wild-type, SOD1 = SOD1 G93A genotype, E = etomoxir, P = placebo.

