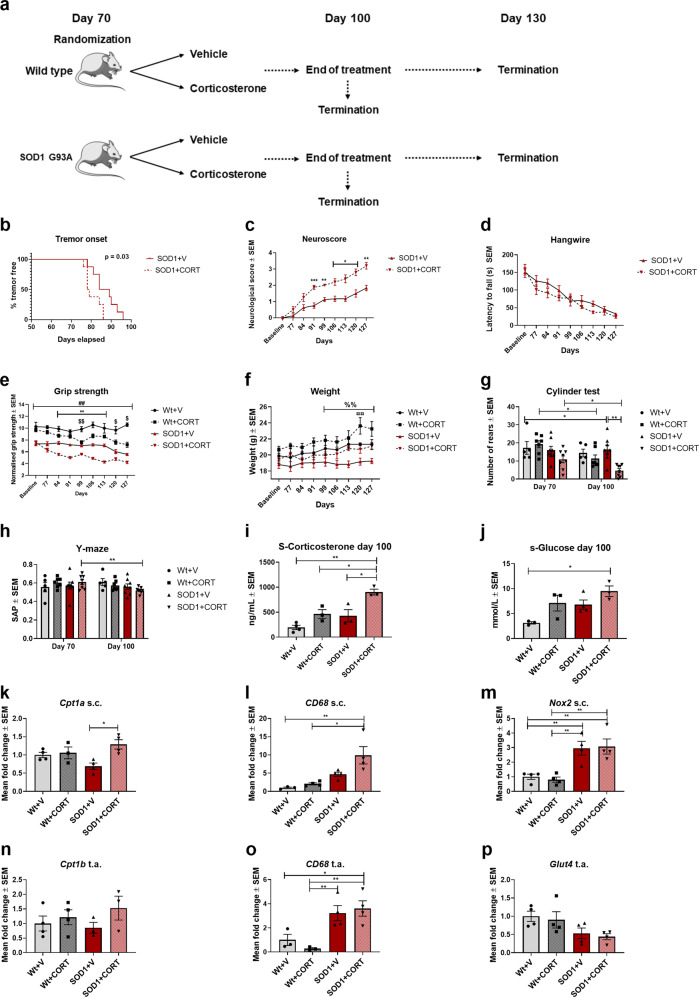
Fig. 9. Corticosterone accelerates disease progression in the SOD1 G93A mouse model.
a Experimental setup, mice were randomized into treatments at approximately day 70 and tested weekly. 3–4 mice were terminated at day 100 and the rest (3–4) were terminated at day 130. b Time point for onset of disease defined as visible tremor in hindlimbs (n = 8), log-rank survival analysis. c Neuroscore was assessed once a week. Data are presented as means ± SEM (n = 8). Mixed effect analysis with Tukey post hoc test. d Hangwire test was performed once a week. Data are presented as mean latency to fall of the grid ± SEM (n = 8). Mixed effect analysis with Tukey post hoc test. e Grip strength was measured once a week from day 70. Data are presented as means ± SEM (n = 5–8). Mixed effect analysis with Tukey post hoc test. f Mean body weight expressed in grams ± SEM (n = 5–8). Mixed effect analysis with Tukey post hoc test. g Cylinder test was performed at day 70 and day 100. Data are presented as mean rears ± SEM (n = 5–8). Repeated measure two-way ANOVA with Tukey post hoc test. h Y-maze test was conducted at day 70 and day 100. Data are presented as mean spontaneous alternation percentage ± SEM (n = 5–8). Paired t-test. i Corticosterone levels in serum obtained at day 100 was analyzed using ELISA. Data are presented as mean ng/mL (n = 3–4). Two-way ANOVA with Tukey post hoc test. j Glucose levels in serum at day 100. Data are expressed as mean mmol/L ± SEM (n = 3–4). Two-way ANOVA with Tukey post hoc test. k–m Cpt1a, Cd68, and Nox2 gene expression in the lumbar spinal cord from mice terminated at day 130. Data are presented at mean normalized fold-change. Expression was normalized to β-actin and Gapdh. N = 3–4. Two-way ANOVA with Tukey post hoc test. n–p Cpt1b, Cd68, and Glut4 gene expression in the tibialis anterior muscle from mice terminated at day 130. Data are presented at mean normalized fold-change. Expression was normalized to β-actin and Gapdh. N = 3–4. Two-way ANOVA with Tukey post hoc test. Data are representative of two animal experiments. Serum and RT-qPCR experiment was conducted once. *Significant differences between SOD1 + V and SOD1 + CORT, #significant difference between SOD1 and Wt, $significant differences between Wt + V and Wt + CORT, % significant differences between SOD1 + V and Wt-CORT in body weight analysis, ¤significant difference between Wt+CORT and SOD1 + CORT in body weight analysis. *p ≤ 0.05; **p ≤ 0.01; #p ≤ 0.05; ##p ≤ 0.01, $p ≤ 0.05, $$p ≤ 0.01, % p ≤ 0.05, %%p ≤ 0.01. WT = wildtype, SOD1 = SOD1 G93A genotype, V = Vehicle, CORT = Corticosterone. Mouse figure used in experimental setup figures were obtained from; https://smart.servier.com/ and used according to the Creative Commons Attribution 3.0 Unsupported License.

