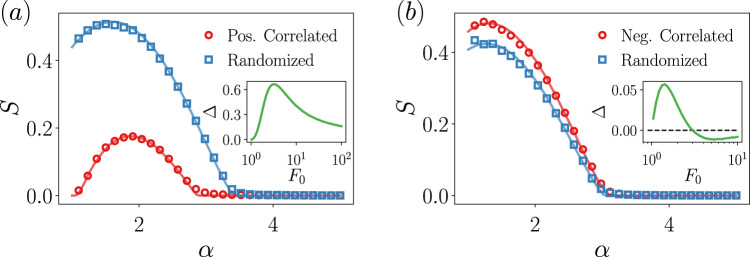
Fig. 3. Percolation in correlated degree-feature networks.
Size of the giant connected component for (a) the positively correlated distribution Eq. (10) and for (b) the negatively correlated distribution Eq. (14), and their randomized counterparts. All nodes with feature F ≥ F0 = 3, are removed. Points are the results from simulations and the solid line comes from the theory. Network sizes are N = 216 and each point is averaged over 100 realizations. In the inset of the panels, we display Δ(F0), corresponding to the area between the randomized and correlated curves and defined in Eq. (13), as a function of the feature threshold. The integral has been computed in the region α ∈ (1, 5].

