
Fig. 1. Heatmap representing UTMOST significant genes across weight sets and brain areas.
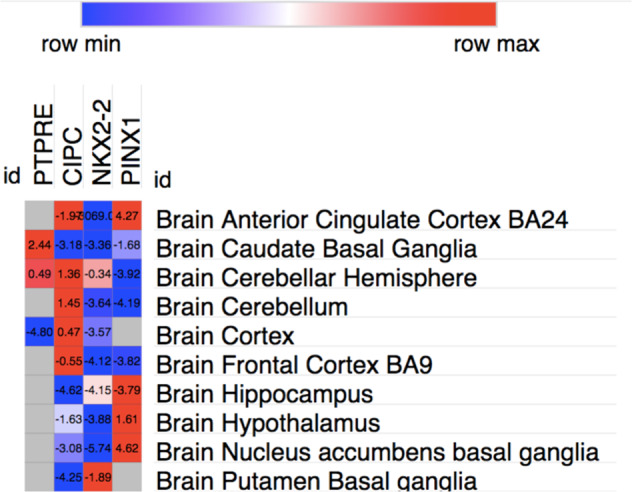
UTMOST significance as a Z score is ~4.6. Gray squares indicate that gene weights were not available in the target tissue.
Official websites use .gov
A
.gov website belongs to an official
government organization in the United States.
Secure .gov websites use HTTPS
A lock (
) or https:// means you've safely
connected to the .gov website. Share sensitive
information only on official, secure websites.
UTMOST significance as a Z score is ~4.6. Gray squares indicate that gene weights were not available in the target tissue.