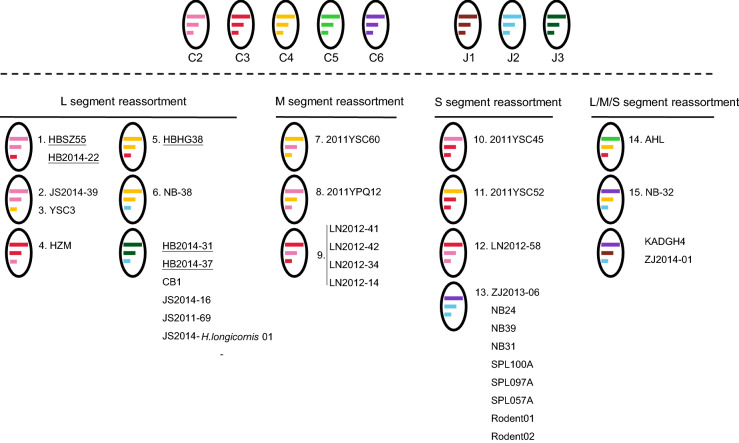
Fig. 2.
Graphical representation of SFTSV reassortment events listed with the potential reassortants. Segments of each genotype are indicated by different colors. The L, M, and S segments are indicated by different line lengths. Reassortants from the Hubei Province are underlined. Reassortants identified by RDP packages are numbered in accordance with the events listed in Supplementary Table S5.

