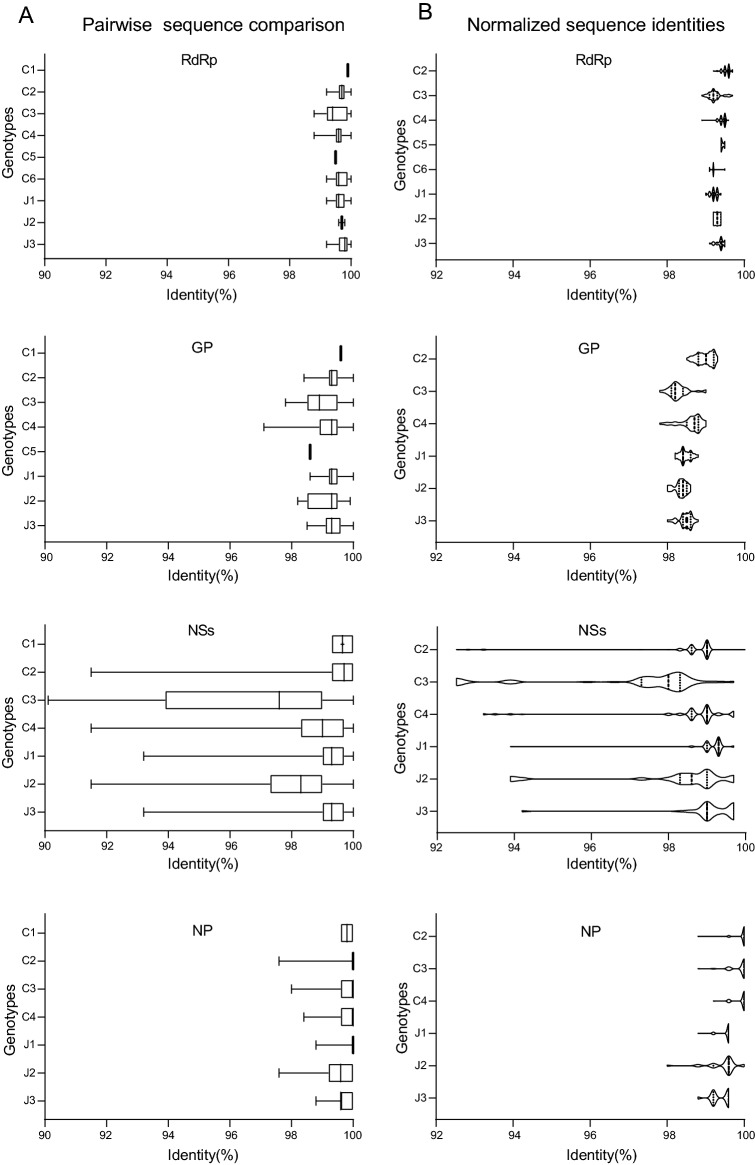
Fig. 4.
Comparison of genomic sequence identity of SFTSV strains. A Pairwise sequence comparison of SFTSV strains within the same genotype. The identity range is plotted as a box plot for each genotype. The upper and lower bars represent the maximum and minimum values, respectively. The box shows identities ranging from 25% to 75% of the total values, and the solid line in the middle indicates the median. B Normalized sequence identities of SFTSV strains to the C1 genotype SD4/China/2010 strain, plotted as violin plots. The median and quartile identities are indicated by “(solid dotted lines)” and “(dotted lines)”, respectively.

