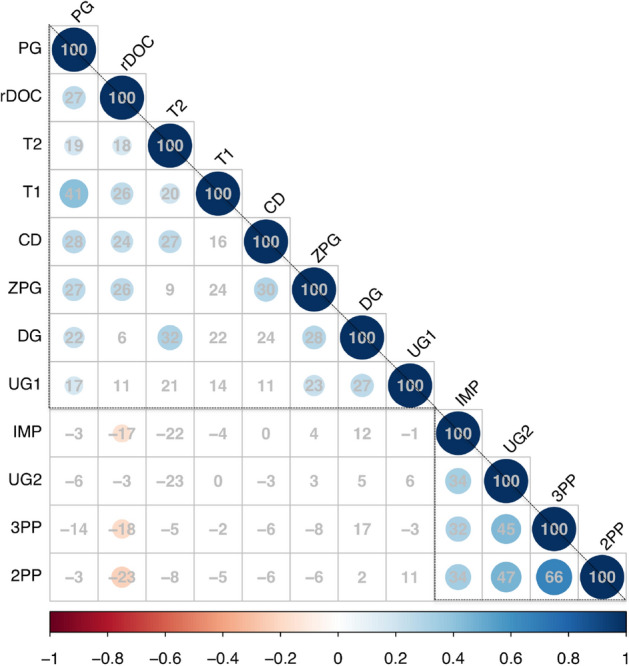
Figure 2.

Spearman correlation matrix of behavior in game-theoretic paradigms. Colored cells represent significant correlations corrected with the Holm’s method. Numbers are correlation coefficients presented in percentages. Variables are ordered on the basis of the first principle component, triangles are manually super-imposed to highlight two potential groups of decisions. PG (contributions in a public good game), TG1 and TG2 (amounts entrusted and returned as 1st and 2nd mover in a trust game, respectively), rDOC (restraint in a dilemma of the commons), CD (amounts donated to charities), ZPG (frequency of helping choices in the Zurich prosocial game), DG (transfers in a dictator game), UG1 (offer size in an ultimatum game), UG2 (frequency of rejections in an ultimatum game), IMP (frequency of rejections in an impunity game), 2PP and 3PP (amount spent to punish norm violators in 2nd and 3rd party punishment games).
