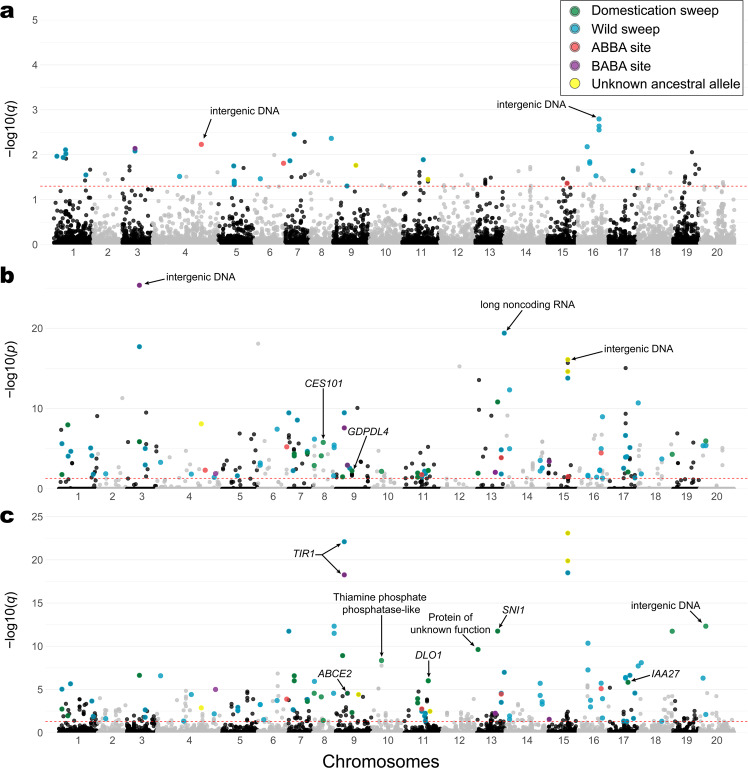
Fig. 5. Putative footprints of selection associated with the domestication of Cucurbita argyrosperma.
Manhattan plots representing the a BayeScEnv, b PCAdapt, and c LFMM 2 tests in each chromosome of the genome. The red dotted line indicates the cutoff value (q-value or Bonferroni-corrected p-value < 0.05) to determine a candidate locus. Only 110 loci were retrieved as candidate SNPs by more than one test, which are highlighted depending on whether the putative signal of positive selection corresponds to argyrosperma (green), sororia (blue), an ABBA site (red) a BABA site (purple) or an unknown selective direction (yellow). The arrows indicate the position of some of the discovered candidate genes

