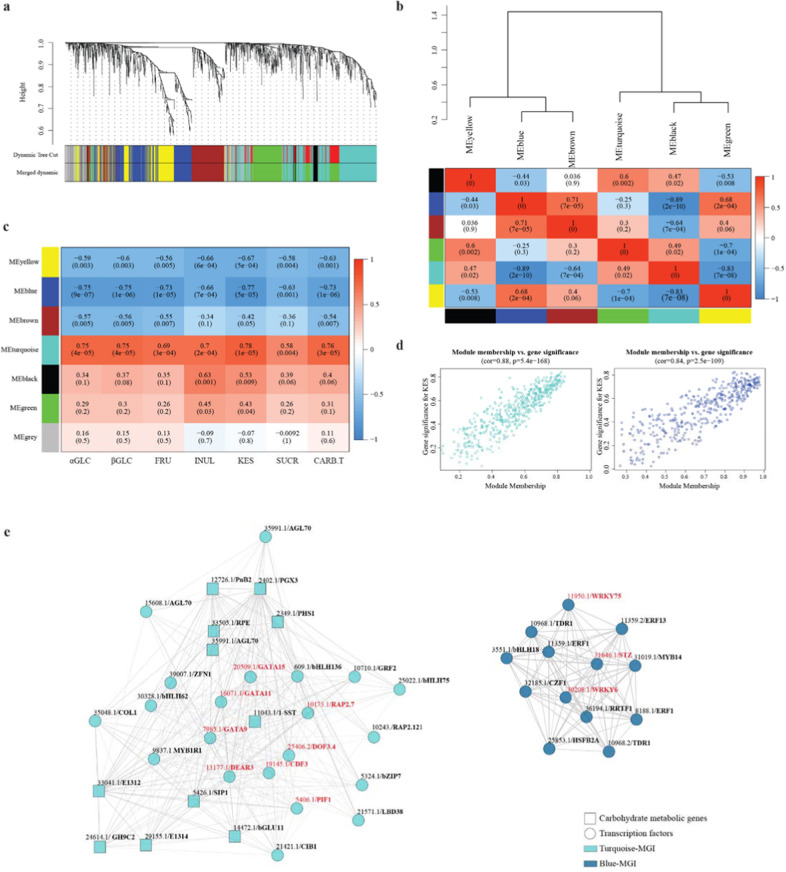
Fig. 3. WGCNA and identification of regulatory genes of kestose contents.
WGCNA of carbohydrate metabolic process and transcription factor genes from two productions. a Cluster dendrogram showing different modules (by colour) of co-expressed genes as identified by the Dinamic Tree Cut algorithm and by merging modules sharing a correlation above 0.75. The grey module included genes that did not belong to any other modules. b Hierarchical clustering dendrogram (upper panel) and correlation heatmap (lower panel) of module eigengenes (ME) to examine higher-order relationships between the modules. Correlations and corresponding p-values in parenthesis are in coloured boxes. c Heatmap of module-carbohydrates correlations. Acronyms of sugars are in Fig. 1d legend. d Scatterplots of module membership vs genes significance in the blue and turquoise modules. e Cytoscape representation of the module of genes of interest (MGI) within blue and turquoise modules. Edges with weight above a threshold of 0.2 are shown. The transcript numbers and annotations (listed in Table S8) are above the circles (transcription factors) and squares (carbohydrate genes). TF putatively binding 1-SST are in red

