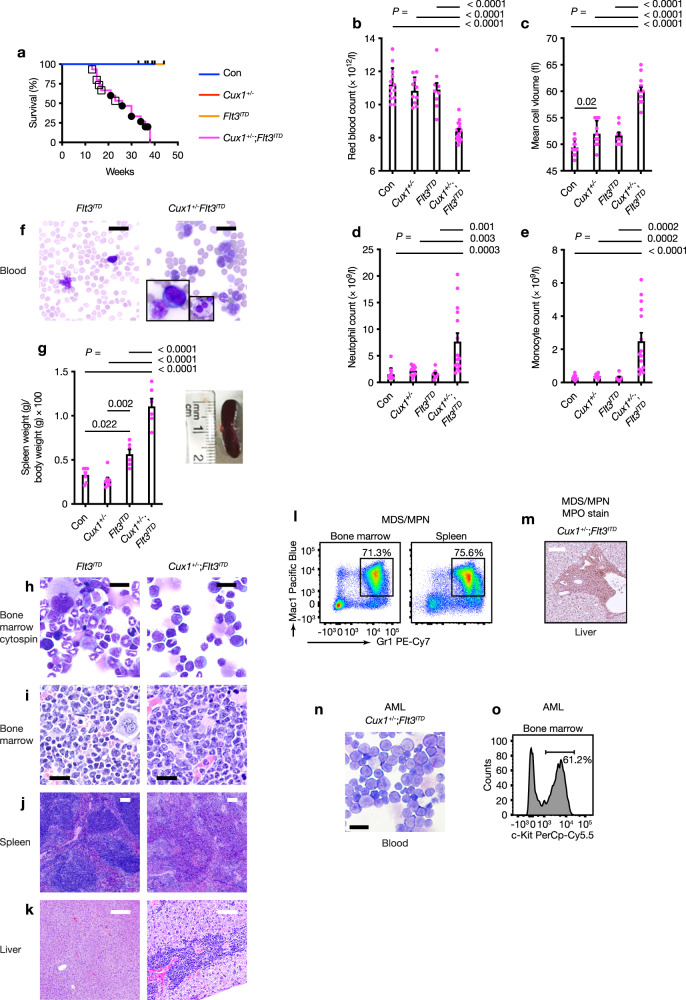
Fig. 2. Flt3ITD mutation cooperates with Cux1 haploinsufficiency to induce MDS/MPN and AML in vivo.
a Kaplan–Meier survival curve of Cux1+/−;Flt3ITD (n = 14, magenta line), Flt3ITD (n = 9, orange line), Cux1+/fl;Vav-iCre+ (Cux1+/−) (n = 11, red line) and control (Vav-iCre+/− or Cre-negative littermates, Con, n = 11, blue line) mice. Increased mortality in Cux1+/−;Flt3ITD mice (median survival 28 weeks; control Con versus Cux1+/−;Flt3ITD, P < 0.0001; Cux1+/− versus Cux1+/−;Flt3ITD, P < 0.0001; Flt3ITD versus Cux1+/−;Flt3ITD, P = 0.0002; log-rank test). Open square symbols indicate those mice diagnosed with MDS/MPN and black circles indicate AML cases. b–e Red blood cell count (b), red blood cell mean cell volume (c) neutrophil count (d) and monocyte count (e) in control Con (n = 13), Cux1+/− (n = 10), Flt3ITD (n = 9) and Cux1+/−;Flt3ITD (n = 15) mice at 10 weeks of age. f Representative May-Grünwald-Giemsa (MGG)-stained blood smears from 10-week-old Flt3ITD (left) and Cux1+/−;Flt3ITD (right) mice. Insets show an abnormal monocyte and blast cell (left); dysplastic neutrophil (right). Scale bar, 20 µm. Five Flt3ITD and 10 Cux1+/−;Flt3ITD mice were assessed. g Plot of necropsy spleen weights normalized to body weight (left) from control Con (n = 7), Cux1+/− (n = 8), Flt3ITD (n = 6) and Cux1+/−;Flt3ITD (n = 6) mice. Photograph of representative spleen from 10-week-old Cux1+/−;Flt3ITD mouse (right). h–k Representative MGG-stained bone marrow cytospin (h) and hematoxylin and eosin (H&E)-stained bone marrow (i), spleen (j) and liver (k) sections from 17-week-old Flt3ITD (left) and Cux1+/−;Flt3ITD (right) mice. Bone marrow and tissues are infiltrated with excess myelomonocytic cells in the Cux1+/−;Flt3ITD mouse. Scale bars; black = 20 µm, white = 100 µm. Five Flt3ITD and 10 Cux1+/−;Flt3ITD mice were assessed. l Flow cytometric plot showing distribution of Gr1+ and Mac1+ cells in bone marrow (left) and spleen (right) from a 15-week-old Cux1+/−;Flt3ITD mouse diagnosed with CMML. Percentage of Gr1+Mac1+ cells is shown. m Immunohistochemistry of liver section from a 15-week-old Cux1+/−;Flt3ITD mouse diagnosed with MDS/MPN showing infiltration with myeloperoxidase (MPO)-expressing cells. Scale bar, 100 µm. Three mice were assessed. n Representative MGG-stained blood smear showing blast cells from a 30-week-old Cux1+/−;Flt3ITD mouse diagnosed with AML. Scale bar, 20 µm. Five mice were assessed. o Flow cytometric plot showing percentage of c-Kit+ AML cells in bone marrow from a 30-week-old Cux1+/−;Flt3ITD mouse diagnosed with AML. All plots show mean + s.e.m. Each circle represents one mouse. One-way ANOVA with Tukey’s test for multiple comparisons.

