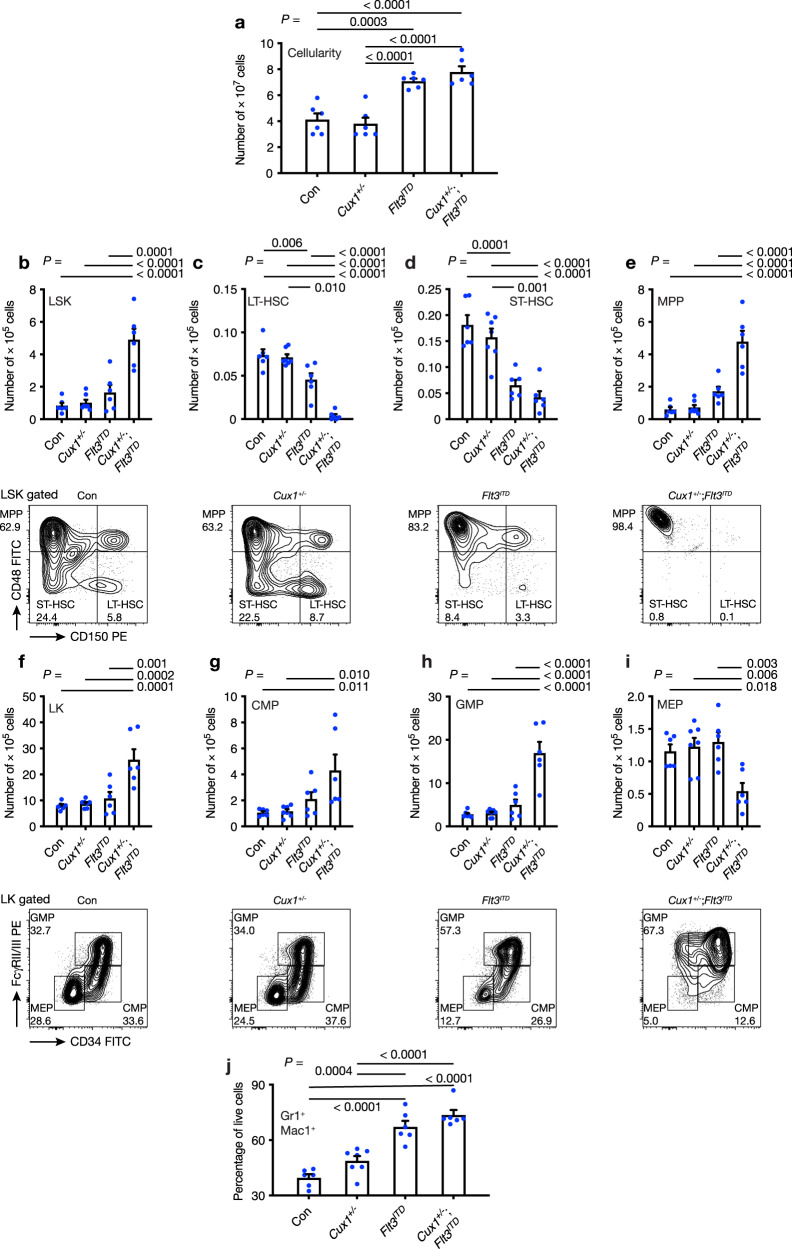
Fig. 4. Defective hematopoietic stem and progenitor cell homeostasis in Cux1+/−;Flt3ITD mice.
a Total bone marrow cellularity of two legs from control Con (n = 6), Cux1+/− (n = 7), Flt3ITD (n = 6) and Cux1+/−;Flt3ITD (n = 6) mice at 10-12 weeks of age. b–e Plots showing absolute numbers of LSK (b), LT-HSC (c), ST-HSC (d) and MPP (e) cells in mice from the indicated genotypes. Representative flow cytometry plots are shown below each bar plot. (f–i) Plots showing absolute numbers of LK (f), CMP (g), GMP (h) and MEP (i) cells in mice from the indicated genotypes. Representative flow cytometry plots are shown below each bar plot. j Percentage of Gr1+Mac1+ myeloid cells in the bone marrow of mice from the indicated genotypes (n = 6 per group). All plots show mean + s.e.m. Each circle represents one mouse. One-way ANOVA with Tukey’s test for multiple comparisons.

