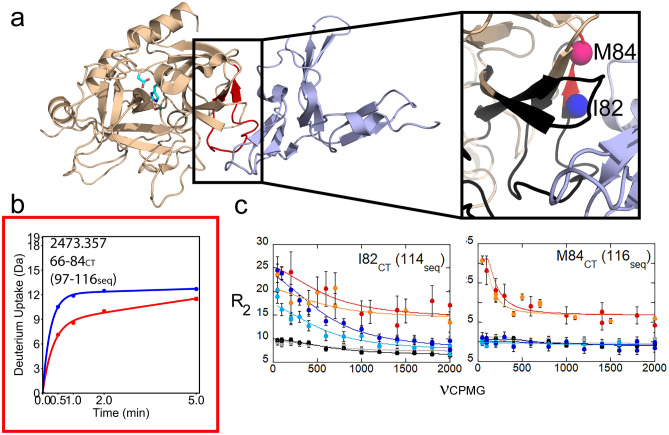
Figure 1.
(a) Structure of thrombin (wheat) bound to TM456 (light blue) [PDB ID: 1DX5]. The side chains of the catalytic triad are shown as cyan sticks. Thrombin residues 66-84CT (97-116seq) of the 70sCT loop are colored red (left). A close-up of the 30sCT and 70sCT loops (right) has residues missing from the thrombin-TM456 HSQC colored black, and the amides in this strand for which CPMG data was obtained as spheres. For all figures, pink spheres indicate residues with NH resonances experiencing increased μs-ms dynamics in thrombin-TM456 and blue spheres indicate residues with NH resonances experiencing reduced μs-ms dynamics as compared to apo-thrombin. (b) Deuterium uptake plots for the peptide spanning residues 66-84CT (97-116seq; MH + 2473.357) in apo-thrombin (blue) compared to thrombin bound to TM456 (red). Error bars (standard deviation of three replicates) are shown. (c) CPMG plots for resonances corresponding to Ile 82CT (112seq) and Met 84CT (116seq). For all figures, the red and orange curves are from spectra collected on thrombin-TM456 at 800 MHz and 600 MHz respectively, the blue and cyan curves are from apo-thrombin at 800 MHz and 600 MHz respectively, and the black and grey curves are from PPACK-thrombin at 800 MHz and 600 MHz respectively. For all figures, molecular structures were produced in PyMol, deuterium uptake plots were produced in DECAv112 (
available at https://github.com/komiveslab/DECA), NMR spectra were plotted in SPARKY (available at https://nmrfam.wisc.edu/nmrfam-sparky-distribution/), and NMR CPMG curves were plotted in Kaleidagraph v4.5.3.

