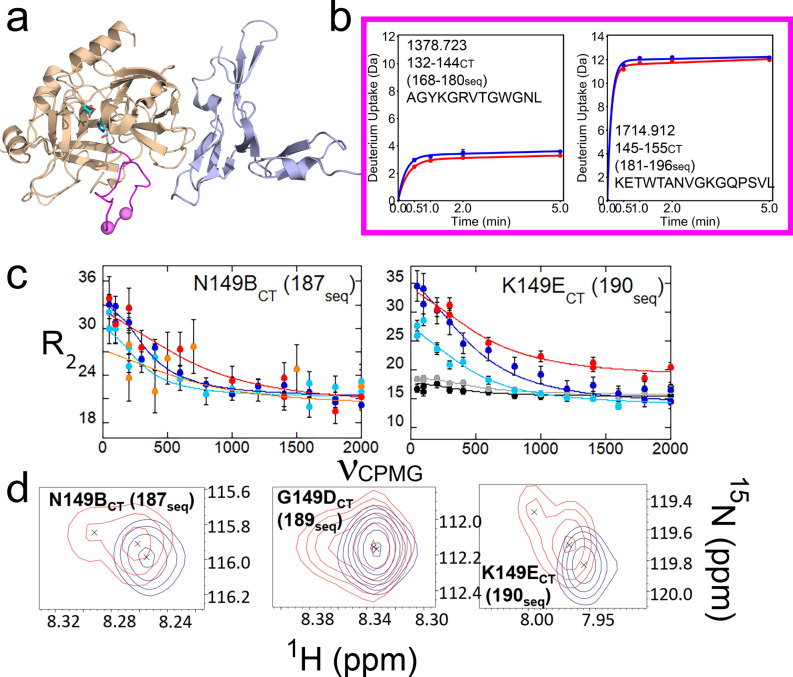
Figure 6.
(a) Structure of thrombin (wheat) bound to TM456 (light blue) [PDB ID: 1DX5]. Residues 140-155CT (176-196seq) of the 140sCT loop are colored magenta. The amides of residues corresponding to resonances experiencing μs-ms dynamics in both thrombin-TM456 and apo-thrombin are shown as violet spheres. Sidechains are shown for the catalytic triad (cyan). (b) Deuterium uptake plots for the peptides spanning residues 132-144CT (168-180seq; MH + 1378.723) and 145-155CT (181-196seq; MH + 1714.912). The colors are the same as in previous figures. (c) CPMG plots for thrombin resonances corresponding to residues Asn 149BCT (187seq) and Lys 149ECT (190seq). The colors of the curves are the same as in previous figures. CPMG data could not be obtained from the 600 MHz spectra for Thr 149CT (187seq). (d) Examples of thrombin-TM456 HSQC (red) doublet resonances compared to apo-thrombin (blue) resonances for residues in the 140sCT loop.

