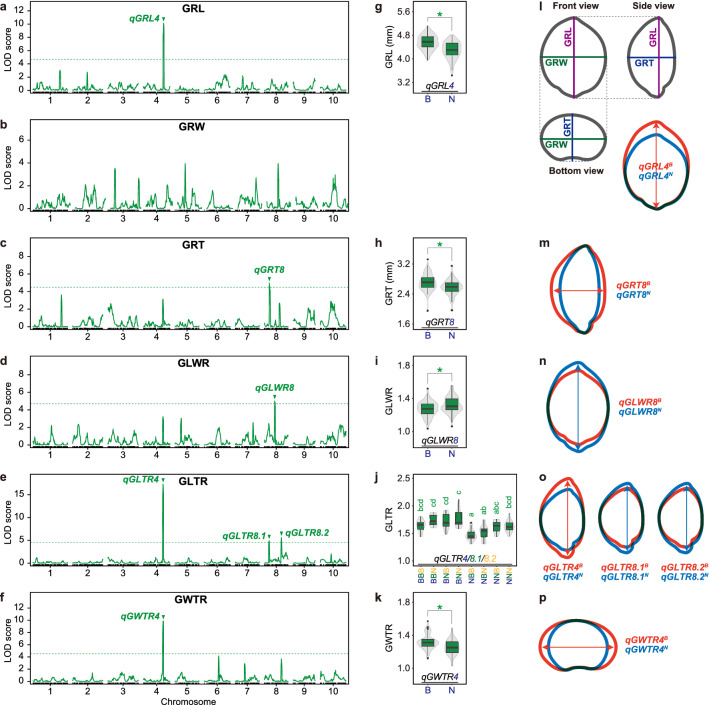
Figure 5.
Results of QTL analysis for the six grain-related traits (a–f), their allelic effects (g–k), and schematics of the allelic effects (l-p). (a,g,l) Grain length, (b) grain width, (c,h,m) grain thickness, (d,i,n) grain length/width ratio, (e,j,o) grain length/thickness ratio, and (f,k,p) grain width/thickness ratio. (a–f) LOD profiles obtained from composite interval mapping (CIM). Horizontal dotted lines represent a threshold of the 1000 × permutation test (P < 0.05). (g–k) Contributions of SNP genotypes for significant QTLs. Box and violin plots show the effects of the nearest marker genotypes for each QTL or allelic combinations of QTLs. Different letters denote significant differences according to the Tukey–Kramer test (P < 0.05). Asterisks indicate significant differences between genotypes (Welch’s t-test, P < 0.01).

