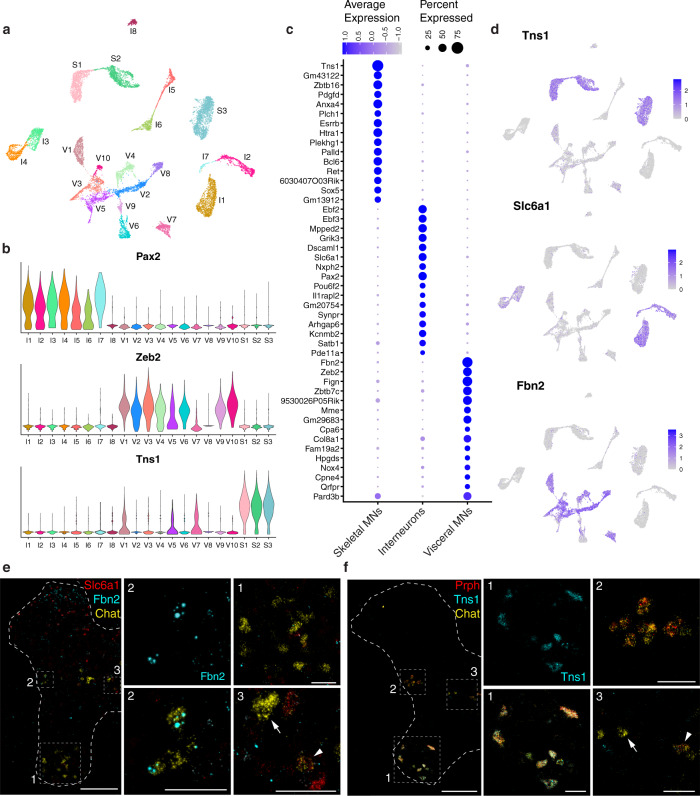
Fig. 2. Classification of cholinergic neurons reveals the extensive diversity of motor neurons and interneurons.
a UMAP of all 16,042 cholinergic nuclei showing 21 distinct clusters. b Expression of marker genes for cholinergic interneurons (Pax2), visceral MNs (Zeb2), and skeletal MNs (Tns1) in the 21 cholinergic clusters. c Dot plot showing the top 15 marker genes for each main cholinergic subtype. d Feature plots depicting expression of the top novel marker gene for each cholinergic subtype. e RNAScope for novel marker genes for a subset of interneurons (Slc6a1, red) and visceral MNs (Fbn2, cyan) co-expressing with Chat (yellow). Interneurons in the intermediate zone (box 3) are double positive for Slc6a1 and Chat (arrowhead) or only express Chat (arrow); visceral MNs in the lateral horn (box 2) are double positive for Fbn2 and Chat, and skeletal MNs in the ventral horn (box 1) are only Chat+. f ISH for novel marker gene Tns1 (cyan) highlights skeletal MNs, showing restricted localization to the ventral horn and co-expression with Chat in cells with the distinctive cell body shape of skeletal MNs. Co-labeling with Prph (red) and Chat (yellow) highlights skeletal MNs in the ventral horn (box 1) that are triple positive, visceral MNs in the lateral horn (box 2) that are double positive for Chat and Prph, and interneurons in the intermediate zone (box 3) that are only positive for Chat (arrow) or occasionally double-positive for Chat and Prph (arrowhead). e, f: thoracic spinal cord; all images are merged for the 3 colors except for Fbn2 and Tns1, shown alone, as marked. Full single-color images and merges are shown in Supplementary Fig. 6. Low magnification image scale bars, 200 µm. High magnification scale bars, 50 µm.

