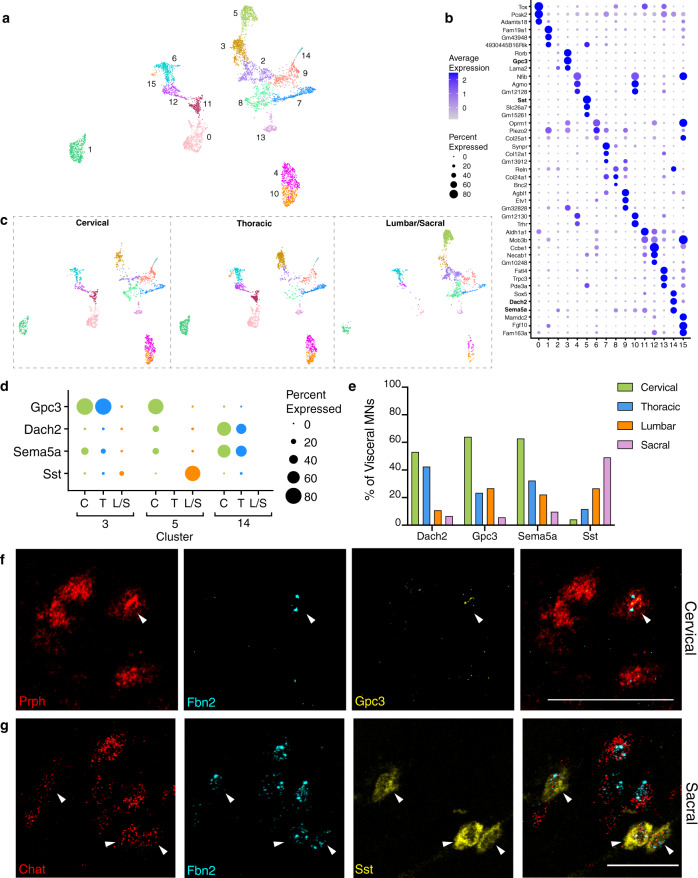
Fig. 6. Visceral motor neurons exhibit extensive diversity in their gene expression profiles and anatomic localization.
a Visceral motor neurons can be re-clustered into 16 distinct sub-clusters. b Dot plot showing the top three marker genes for each cluster. Genes in bold font are shown by ISH below. c UMAPs displaying the visceral motor neuron clusters derived from each separately barcoded segment of the spinal cord. Clusters 0, 1, 3, 4, 10, 11, 12, 14, 15 are sparse or missing from the lumbar/sacral segment; conversely, cluster 5 is unique to the lumbar/sacral segment, where cluster 2 is also most abundant. Cluster 8 is most sparse in thoracic, while clusters 3 and 15 are most abundant in thoracic, and cluster 14 is most abundant in cervical. d Dot plot showing expression of marker genes for uniquely cervical/thoracic (C/T) or lumbar/sacral (L/S) clusters in each segment of the spinal cord, with Gpc3, Dach2, and Sema5a most highly expressed in rostral levels and Sst most highly expressed in caudal levels. e Quantification of each level-specific cluster marker in visceral MNs of each spinal cord level, shown as percent of Fbn2 + MNs expressing each gene (N = 2 animals), highlighting rostral expression of Gpc3 (cervical n = 100 neurons, thoracic n = 64, lumbar n = 41, sacral n = 140), Dach2 (cervical n = 175 neurons, thoracic n = 139, lumbar n = 92, sacral n = 91), and Sema5a (cervical n = 180 neurons, thoracic n = 142, lumbar n = 72, sacral n = 92) and caudal expression of Sst (cervical n = 144 neurons, thoracic n = 77, lumbar n = 75, sacral n = 110), as predicted by the sequencing data. f ISH showing Gpc3 + (yellow) visceral MNs, likely representing cluster 3 neurons, in the cervical spinal cord. g ISH showing Sst+ visceral MNs (yellow), likely representing cluster 5 neurons, in the sacral spinal cord. Scale bars, 50 µm.

