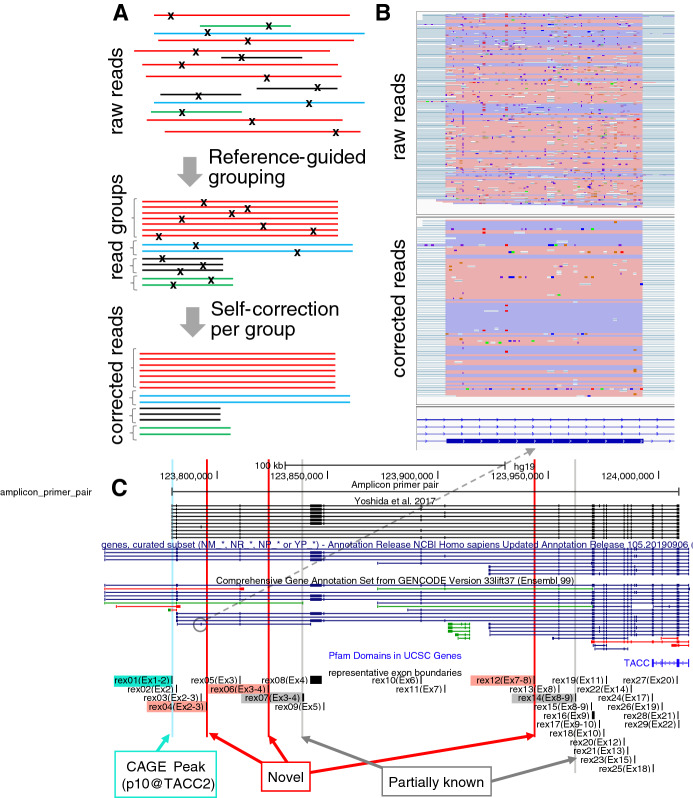
Figure 2.
Sequence error correction and identified exons. (A) Schematic representation of sequence error correction. Individual lines with the same color indicate the same isoform, where “x” indicates sequence errors (B) Sequence matches and mismatches in the alignment before and after sequence error correction, shown in IGV. The pink and blue regions indicate forward and reverse aligned blocks between the reads and the genome. A minor exon, comprising a Gencode gene model ENST00000491540, is shown (referred as rex04). (C) The 29 identified exons: rex01 to rex29. Novel exons are colored by red.

