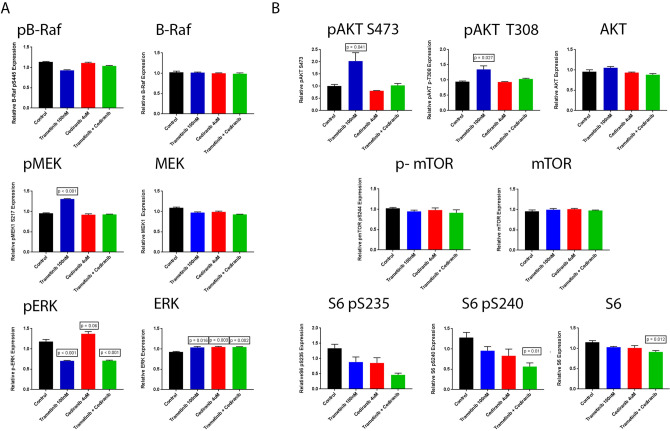
Figure 4.
Reverse phase protein array (RPPA) analysis of HAMON cells treated with Trametinib, Cediranib, and the combination of Trametinib and Cediranib for 72 h. (A) Relative expression of MAPK related proteins and phospho-proteins. (B) Relative expression of AKT/mTOR pathway proteins. Statistically significant comparisons to control are noted, defined as t-test p < 0.05. Other comparisons of treatment to control were not statistically significant. Graphs were made in GraphPad Prism 7 (https://www.graphpad.com/scientific-software/prism/). Unedited/cropped images were formatted in Adobe Photoshop 2020 (https://www.adobe.com/) to create the figure layout.

