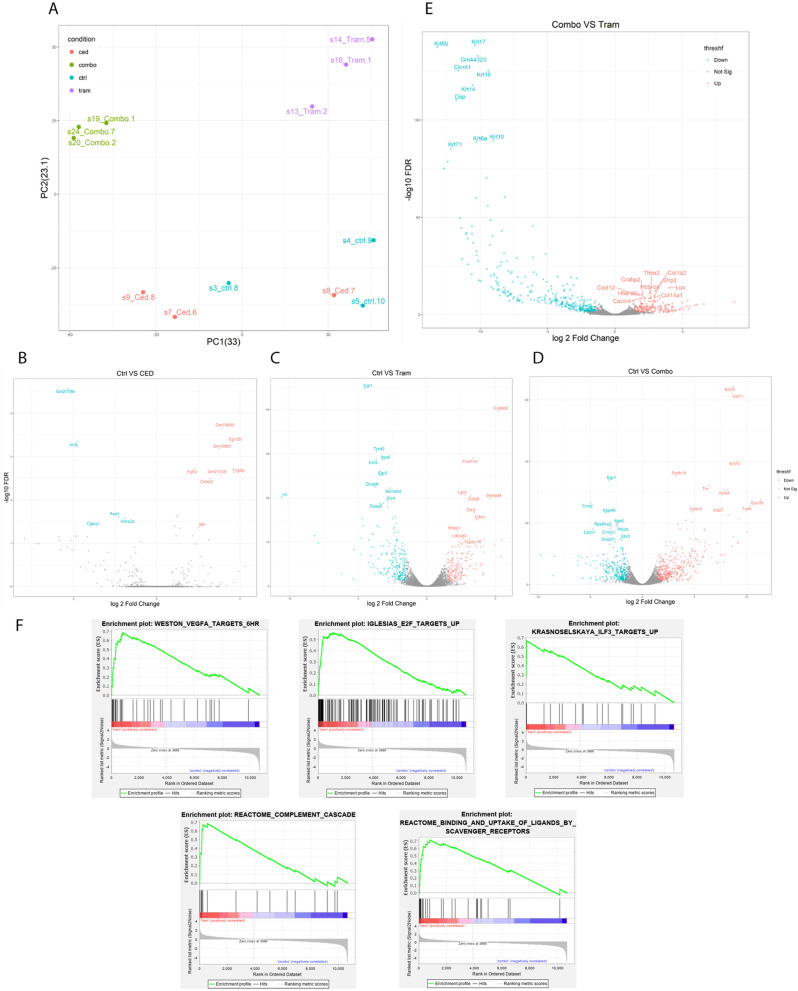
Figure 5.
RNA sequencing of SVR xenograft whole lysate after treatment. (A) Principal component analysis demonstrates 3 distinct patterns of expression, with control (blue) and cediranib (red) treated tumors in one cluster, and trametinib treated tumors (purple) and combined trametinib and cediranib treated tumors (green) clustering separately. (B–D) Volcano plots for cediranib (B), trametinib (C), and combination (D) treated tumors compared to controls vehicle treated tumors. (E) Volcano plot comparing trametinib treated tumors to combination treated tumors. (F) Gene sets enriched in trametinib treated tumors compared with combination treated tumors. Volcano plots were made in R (https://www.r-project.org/). Graphs in panel (F) were made with GSEA software
available at https://www.gsea-msigdb.org/gsea/index.jsp.

