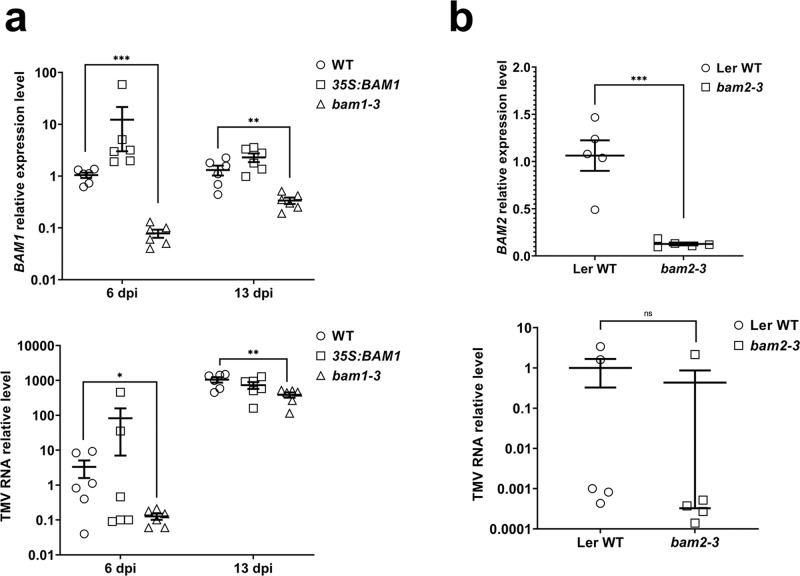
Fig. 3. TMV spread in BAM1 gain-of-function and loss-of-function mutants.
a RT-qPCR analysis of BAM1 mutants. Relative expression levels of BAM1 (upper panel) and relative levels of TMV genomic RNA (lower panel) in systemic leaves of the wild type, gain-of-function (35S:BAM1), and loss-of-function Arabidopsis Col-0 lines (bam1-3) at 6 and 13 dpi. b RT-qPCR analysis of BAM2 mutants. Upper panel: relative expression levels of BAM2 in the leaves of the loss-of-function Arabidopsis Ler-0 line (bam2-3). Lower panel: relative levels of TMV genomic RNA in the systemic leaves of the loss-of-function Arabidopsis Ler-0 line (bam2-3) at 6 dpi. Error bars in a, b represent standard error of six and five biological replicates, respectively. Asterisks indicate statistically significant differences between the tested plants and the control wild-type (WT) plants; *P < 0.05, **P < 0.01, and ***P < 0.001; ns not statistically significant (P ≥ 0.05).

